Follow the steps below to confirm the results of the DUT’s spectrum monitor measurement by using the E5052B’s spectrum monitor measurement window.
To improve readability and reduce search time, few sections of this topic are combined with similar sections from other measurements in Measurement > Common Settings. Links to these new sections are provided in this topic.
Press Marker to display marker 1 on the screen.
Press Marker Search > Peak - Search Peak to move marker 1 to the position of carrier frequency.
Press Marker -> > Marker->Center to move the frequency in which the carrier resides to the center of the sweep range.
Press Start/Center (Stop/Span) > Carrier to to move the frequency at which the carrier resides to the center of the sweep range.
Press Carrier x1 -> Center to move the frequency at which the first harmonic resides, to the center of the sweep range. Pressing Carrier x2 -> Center or Carrier x3 -> Center moves the frequency at which the second or the third harmonic respectively resides, to the center of the sweep range.
To move the frequency in which an n-order harmonic resides to the center of the sweep range, press Harmonic # and enter the number corresponding to n, and then press Carrier x# -> Center.
“No Signal Found” may error occur when the attenuator setting is not appropriate. Refer to Error Messages for more detail explanation.
You can select the unit (format) used in the spectrum monitor measurement trace screen and switch to the detector mode.
The E5052B displays the measurement value at the specified point; actually, it sweeps (measures) with the resolution determined by the RBW. The detector captures all of the signals not only at the display point but also between individual display points. If there are more measurement points than display points, you must select the detector mode so that each display point is converted from the individual value of multiple measurement points.
In the "Positive" mode, the E5052B displays the maximum value (peak) of the measurement values between the display points. In the "Sample" mode, the E5052B displays the measurement value at the nearest measurement point to the display point.
Press Format > Format.
Select the appropriate format from the softkey menu list. The available options are as follows.
Format List
|
Format |
|
|
dBm |
dBm / Hz |
|
dBV |
dBV / Hz |
|
Watt |
Watt / Hz |
|
Volt |
Volt / Hz |
Press Format > Detector Mode.
Select the appropriate detector mode from the softkey menu list. You can choose either Positive or Sample. Positive is selected by default.
Press Marker to display marker 1 on the screen.
Move marker 1 to the point you want to confirm and read the measurement value displayed in the upper part of the graph. To confirm multiple values, press Marker > Marker x (x=1 to 10), which allows you to display up to marker 10.
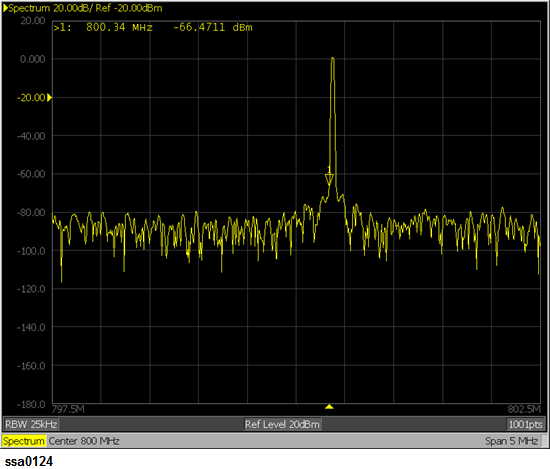
Example of Measurement Screen (spectrum)
In this measurement, you cannot specify the sweep time. It will be determined automatically based on the frequency sweep range and measurement resolution bandwidth.