This is an application software for calculating RMS jitter from phase noise measurement results based on the transfer functions (filters) defined by each PCIe reference clock architecture.
Follow these steps to start up the program.
Press Macro > Macro 1 > PCIe Clock jitter.
Note: When the macro button is not available, execute “C:\Program Files\Keysight\Network Analyzer\PCIeJitter.exe”
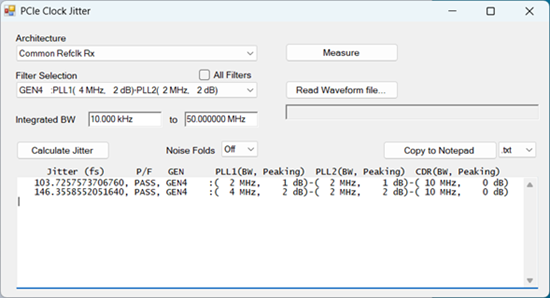
Once the application is executed the following dialog box is displayed and the measurement screen will be set as shown in Display Windows
| Architecture: | Select PCIe Refclk Architecture from the following list.
|
| Filter Selection: | Select the combination of Transfer Functions (Filters) for the specific architecture. Checking the box of All Filters selects all filter combinations.
The number of filter combinations of each architecture is the following.
|
Integrated BW |
Specify the integration range for the jitter calculation.
|
Get the phase noise measurement data by following either way.
Actual measurement
Click Measure button to trigger the phase noise measurement of Ch1:Phase Noise channel. The measurement result is shown on the top window of the FW display. The PCIe Clock Jitter application doesn’t wait for the completion of the measurement, because phase noise measurement may take a very long time.
The current settings in Phase Noise measurement class (Ch1) is used. When you want a different setting, select Phase Noise measurement class in Channel 1 at the top window of the firmware GUI and change the settings. All phase noise data must be the normalized dBc/Hz data and should not include the dBc power data which is used for the spur analysis mode.
If Spur Analysis is enabled, Omit Displayed Spurs also should be enabled.
When “Measure” button is pushed, phase noise data read from waveform file is lost if exists.
Waveform data
The phase noise data read from the specified waveform file is used for the jitter calculation instead of the measurement result of phase noise channel.
After reading waveform file successfully, the edit box which requires the input of Refclk Frequency is shown.
When phase noise data read from waveform file is used to calculate jitter, the full path name of waveform file is displayed just below the “Read Waveform file” button.
You can save waveform file by Save Recall > Save Other > Save Data File..., use CSV Trace (.csv) as File Type. Do not use Trace and Phasenoise parameter (*.csv).
Restriction of file format
Lines start with “#”, “!” and alphabets are skipped to read
First column is the offset frequency and the second column is the phase noise in dBc/Hz. The dBc power data which is used for spur analysis mode should not be included.
Columns beyond the third are ignored
Click Calculate Jitter to show the jitter result. Noise Fold
setting shown below should be selected before calculation. When “All
Filters” check box is checked, Jitter is calculated for all filter
combinations of the selected architecture.
Jitter is calculated by the following steps and displayed on the result
box.
Transfer function (H) of the selected filter is applied to the phase noise data
Integrate the filtered phase noise data across the specified integrated BW
| Noise Fold: | Select the number of Nyquist bands (Fclk/2) above the Nyquist frequency included in the total jitter result.
|
The result of jitter calculation is shown in the result area.
Clicking Copy to Notepad copies the data in result area to the Notepad.
.txt format : same format as displayed
in the edit box
Example:
103.7257573706760, PASS, GEN4 :( 2 MHz, 1 dB)-( 2 MHz,
1 dB)-( 10 MHz, 0 dB)
146.3558552051640, PASS, GEN4 :( 4 MHz, 2 dB)-( 2 MHz,
2 dB)-( 10 MHz, 0 dB)
.csv format
Example:
103.7257573706760,PASS,GEN4,2 MHz,1 dB,2 MHz,1 dB,10 MHz,0 dB
146.3558552051640,PASS,GEN4,4 MHz,2 dB,2 MHz,2 dB,10 MHz,0 dB
Here is an result example of displays.
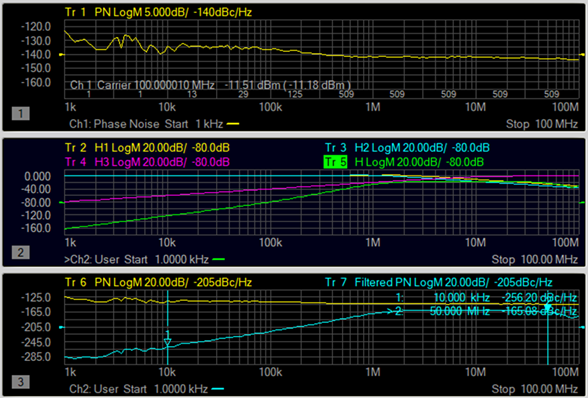
Phase Noise Window (Top)
Channel 1
Measurement Class: Phase Noise
(Tr 1) Phase noise measured on phase noise channel
Activate this window to set the measurement conditions with softkey or dialog
Transfer Functions (Middle)
Channel 2
Measurement Class: User Display
Display traces of the jitter transfer functions, H1, H2, H3 and H, according to the selected filter.
(Tr 2) H1: PLL1
(Tr 3) H2: PLL2
(Tr 4) H3: CDR (Clock Data Recovery)
(Tr 5) H: Overall transfer function calculated with H1, H2 and H3
Unfiltered and Filtered Phase Noise (Bottom)
Channel 2
Measurement Class: User Display
Display unfiltered and filtered phase noise traces
(Tr 6) Unfiltered Phase Noise: One of the following two data
phase noise data measured on phase noise channel (same as the trace displayed on the top window)
phase noise data read from waveform file
(Tr 7) Filtered Phase Noise: This is calculated by applying transfer function (H) to the Unfiltered Phase Noise