How to set the Display Format
Using Hardkey/SoftTab/Softkey
Using a mouse
Press Format > Format 1
Right-click on the trace status area above the grid box.
Click Format.
Select the desired format.
![]()
Add your required traces.
Click Trace > New Traces.
Check the required parameters. You can check multiple traces.
Select the target channel and windows to add the trace(s). New Window adds another window.
Click Apply
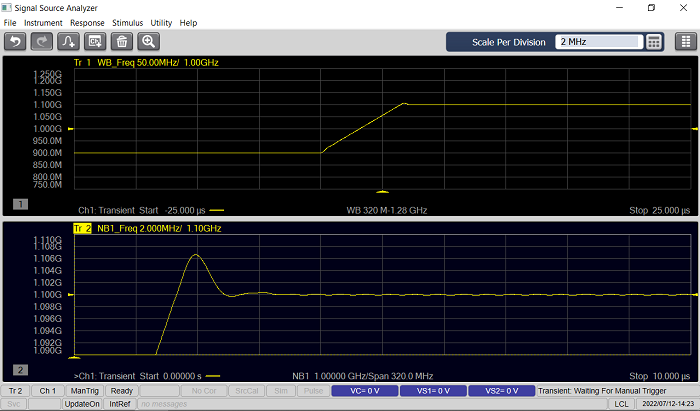
Note: The power in narrow band cannot be selected when the frequency span is over 30 MHz.
Click Trace > New Traces.
Check the box for NB1_Freq
Select the New Window for window selection.
Click Apply
If you want to locate one trace in one window, Click Display > Window Setup > Window Layout > Trace per Window.
Se also
A data format is the way the analyzer presents measurement data graphically.
How to set the Display Format |
|
Using Hardkey/SoftTab/Softkey |
Using a mouse |
|
|
|
|
Frequency for Wideband or Narrowband
Frequency: Absolute frequency in Heltz
ΔFrequency: The difference value from Freq reference. Select from ΔHz, % or ppm for the unit.
Phase for Narowband
Phase: Phase in degree, Radian or Gradian
UPhase: Unwapped phase in degree, Radian or Gradian. Same as Phase, but without 180 degree wrapping.
PPhase: Positive Phase in degree, Radian or Gradian. Displays the phase wrapped between 0 to +360 degrees.
Power for Narrowband
Log Mag in dBm, dBmV, dBuV or dBmA
Lin Mag in W, V or A
Adjust the scale for each trace. The center position is not changed automatically at the center frequency in the Narrow band measurement. See Scale for more detail.
Configure Phase Reference |
|
Using Hardkey/SoftTab/Softkey |
Using a mouse |
When the Narrow band phase is selected:
|
|
|
|
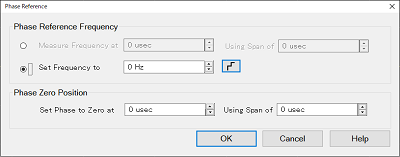
Phase Reference Frequency
Note: There is a difference behavior from the E5052B. The E5052B has “Offset” parameter for phase reference settings and the Phase Reference will be “Reference Frequency” + “Offset”. On the other hand, the “Offset” value will be calculated if the “Set Frequency to” is selected. Phase Zero Position Set Phase to Zero at” value is X Position, “Using Span of” value is X Span.
|
|
Line Regession |
|
Using Hardkey/SoftTab/Softkey |
Using a mouse |
When the Narrow band phase is selected:
|
|
|
|
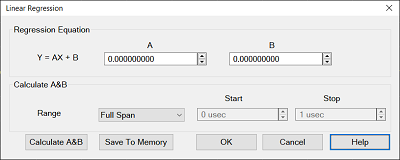
Range - Select the range from full span or custom. When the custom, Specify the start/stop Calculate A&B - Calculate a linear regression parameters, A and B from the data trace in the specified range. Save to Memory - Save the linear regression line data to the memory trace. |
|