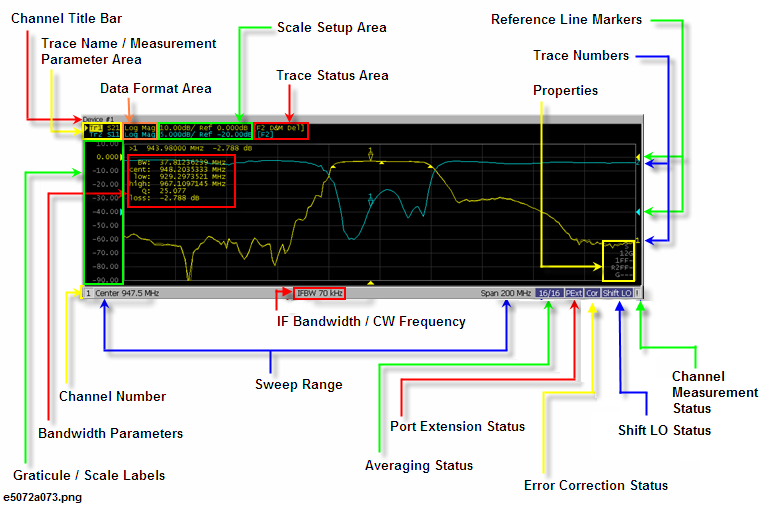
Windows for displaying traces. Because a channel corresponds to a window, it is called a channel window. When the outer frame of a channel window is displayed in light gray, the channel is the active channel (the channel for which setup is being performed). In the following figure, Channel 1 (the upper window) is the active channel. To make a channel active, use Channel Next or Channel Previous key. Clicking inside a channel window will also make the channel active.
Channel 1 Window and Channel 2 Window describes different measurement parameters available in the channel measurement window. The measurement parameters described in the Channel 1 and 2 Window correspond to the same channel measurement window and are displayed in separate windows for ease of read.
Channel 1 Window
Channel 2 Window
Turning on the bandwidth search function displays the bandwidth parameters here.
Indicates the channel number.
The status of each channel is displayed here.
Displays the averaging factor and averaging count when averaging is turned on.
|
n/m (displayed in blue) |
Averaging: ON |
|
(not displayed) |
Averaging: OFF |
Displays the update status of traces on the channel.
|
!
|
Measurement in progress. When the sweep time exceeds 1.5 seconds, ↑ is displayed at the point on the trace. |
|
# |
Invalid traces. The measurement conditions have changed, but the traces on the channel currently displayed have not been updated to match the new conditions. |
|
(No display) |
The measurement has not been executed. |
Displays the execution status of error correction on the channel.
Shows whether the fixture simulator is turned ON or OFF.
|
Sim (displayed in blue) |
Fixture simulator: ON |
|
(not displayed) |
Fixture simulator: OFF |
Indicates the IF bandwidth when the sweep type is linear/log frequency or the CW frequency when the sweep type is power.
Shows whether the port extension is turned ON or OFF.
|
PExt (displayed in blue) |
Port extension: ON |
|
(not displayed) |
Port extension: OFF |
Displays the execution status of power level error correction on the channel. For details, see Turning Power Level Error Correction ON/OFF.
Indicates the sweep range by using the start/stop or center/span.
You can assign a title to each channel and have the title displayed on the bar.
The data format of each trace is displayed here.
Y-axis divisions in the rectangular display format. When traces in the rectangular display format are overlaid, the Y-axis divisions for the active trace are displayed. The value of the reference line (the division line between ![]() and
and ![]() ) is entered numerically by opening the data entry bar using the keys: Scale Key + Reference Value. You can change values of the reference line at one-division intervals by placing the mouse pointer in the area of the graticule label (the pointer changes from
) is entered numerically by opening the data entry bar using the keys: Scale Key + Reference Value. You can change values of the reference line at one-division intervals by placing the mouse pointer in the area of the graticule label (the pointer changes from ![]() to
to ![]() ), moving the pointer vertically with the left mouse button pressed, and then releasing the button at the desired location.
), moving the pointer vertically with the left mouse button pressed, and then releasing the button at the desired location.
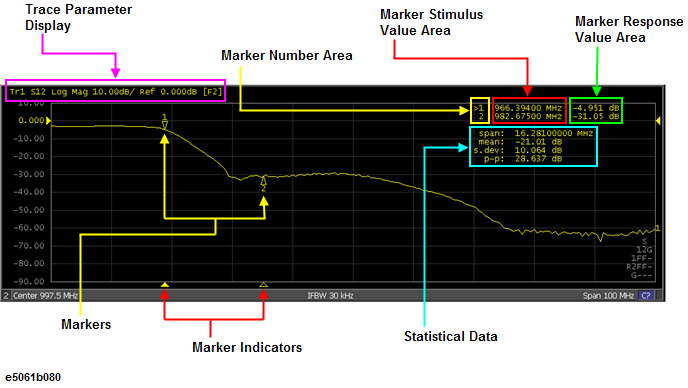
Indicates the positions of markers on the stimulus axis.
|
|
Active marker indicator |
|
|
Non-active marker indicator |
You can also move a marker to the desired position by placing the mouse pointer on the marker indicator or position of the marker itself (the pointer changes from ![]() to
to ![]() ), moving the indicator vertically with the left mouse button pressed, and then releasing the button at the desired location.
), moving the indicator vertically with the left mouse button pressed, and then releasing the button at the desired location.
Displayed marker number is listed. For the active marker (the one for which setup and analysis are being performed), > is displayed at the left of the marker number. For the reference marker, ![]() is displayed instead of the marker number.
is displayed instead of the marker number.
The marker response value for each marker (the measurement value at the marker point) is displayed here. Two (or three) response values are displayed for data in Smith chart or polar display format.
The markers used for reading values on a trace. Up to 10 markers can be displayed for each trace.
|
|
Active marker (the one for which setup and analysis are being performed) |
|
|
Non-active marker |
Here, "n" denotes a marker number. For the reference marker, however, nothing is displayed at the location of n. Clicking the marker or one of the Marker Indicators makes the marker active.
The marker stimulus value for each marker (the frequency/power level at the marker point) is displayed here.
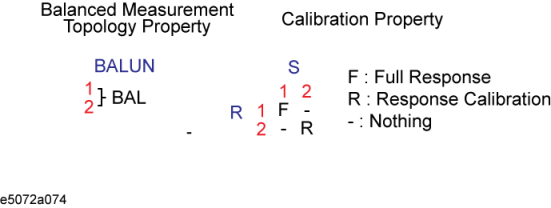
Displays the following properties.
|
Property Name |
Description |
|
Calibration Property |
Displays the status of the obtained calibration coefficients on the channel. For details, see Acquisition status of calibration coefficient for each channel. |
|
Balanced Measurement Topology Property |
Displays the topology for balanced measurement on the channel. For details, see Checking device type and port assignment. |
The indicators that indicate the position of the reference line for the Y-axis scale in the rectangular display format. One indicator is to the right and the other is to the left of the scale (![]() and
and ![]() ). To enter a numeric value for the position of the reference line, open the data entry bar using the keys: Scale > Reference Position. You can also move the position of the reference line by placing the mouse pointer on either of the two reference line indicators (the pointer changes from
). To enter a numeric value for the position of the reference line, open the data entry bar using the keys: Scale > Reference Position. You can also move the position of the reference line by placing the mouse pointer on either of the two reference line indicators (the pointer changes from ![]() to
to ![]() .), moving the indicator vertically with the left mouse button kept pressed, and then releasing the button at the desired location (i.e., a drag-and-drop operation).
.), moving the indicator vertically with the left mouse button kept pressed, and then releasing the button at the desired location (i.e., a drag-and-drop operation).
The scale setting for each trace is displayed here. This example shows that "10.00dB/" corresponds to 10 dB per division. "Ref 0.000dB" shows that the value of the reference line is 0 dB.
Displays the Shift LO status on the channel.
Turning on the statistics data function displays statistics data here.
The names of the traces (Tr1 through Tr9)on the channel and their measurement parameters are displayed here. ![]() to the right of the trace name indicates the active trace (the trace for which setup is being performed). To make a trace active, use Trace Next Key or Trace Prev Key. Clicking the line where the trace name is placed (the mouse pointer changes from
to the right of the trace name indicates the active trace (the trace for which setup is being performed). To make a trace active, use Trace Next Key or Trace Prev Key. Clicking the line where the trace name is placed (the mouse pointer changes from ![]() to
to ![]() ) also makes a trace active.
) also makes a trace active.
In the rectangular display format, the trace number is displayed in the same color as the trace at the right end of each trace.
The setup for each trace is displayed here.
Trace status display
|
Classification |
Contents inside [ ] |
Meaning |
|
Error correction
|
RO |
Error correction: ON (OPEN (n) response calibration) |
|
RS |
Error correction: ON (SHORT (n) response calibration) |
|
|
RT |
Error correction: ON (THRU (n) response calibration) |
|
|
ER |
Error correction: ON (Enhanced response calibration) |
|
|
F1 |
Error correction: ON (1-port calibration ) |
|
|
F2 |
Error correction: ON (Full 2-port calibration / 2-port TRL calibration) |
|
|
Turning on/off traces |
Nothing |
Data trace: ON, Memory trace: OFF |
|
|
M |
Data trace: OFF, Memory trace: ON |
|
|
D&M |
Data trace: ON, Memory trace: ON |
|
|
off |
Data trace: OFF, Memory trace: OFF |
|
Performing data math |
D+M (D+M&M) |
Execution of Data+Mem math |
|
When a memory trace is ON, see the contents inside () |
D- M (D- M&M) |
Execution of Data- Mem math |
|
|
D*M (D*M&M) |
Execution of Data*Mem math |
|
|
D/M (D/M&M) |
Execution of Data/Mem math |
|
Electrical delay |
Del |
A numeric value other than 0 (zero) is specified as the electrical delay or phase offset. |
|
Smoothing |
Smo |
Smoothing: ON |
|
Gating |
Gat |
Gating: ON |
|
Parameter conversion |
Zr |
Conversion: ON (Impedance: Reflection measurement) |
|
|
Zt
|
Conversion: ON (Impedance: Transmission measurement) |
|
|
Ztsh |
Conversion: ON (Impedance: Transmission-Shunt measurement) |
|
|
Yr |
Conversion: ON (Admittance: Reflection measurement) |
|
|
Yt |
Conversion: ON (Admittance: Transmission measurement) |
|
|
Ytsh
|
Conversion: ON (Admittance: Transmission-Shunt measurement) |
|
|
1/S |
Conversion: ON (Inverse S-parameter) |
|
|
Conj |
Conversion: ON (Conjugation) |
|
Power correction |
PC |
Error correction: ON (Power calibration) |
|
Receiver correction |
RC |
Error correction: ON (Receiver calibration) |
|
Scalar-mixer correction |
Cor |
Error correction: ON (Scalar-mixer calibration) |
|
Equation Editor |
Equ |
Equation Editor: ON |