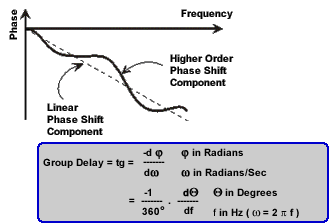
Group delay is a measure of phase distortion. Group delay is the actual transit time of a signal through a device under test as a function of frequency. When specifying group delay, it is important to specify the aperture used for the measurement.
See also Comparing the VNA Delay Functions.
See other Amplifier Parameter topics
Group delay is:
A measure of device phase distortion.
The transit time of a signal through a device versus frequency.
The derivative of the device's phase characteristic with respect to frequency.
Refer to the graphic below for the following discussion:

The phase characteristic of a device typically consists of both linear and higher order (deviations from linear) phase-shift components.
|
Linear phase-shift component: |
Higher-order phase-shift component: |
|
Represents average signal transit time. |
Represents variations in transit time for different frequencies. |
|
Attributed to electrical length of test device. |
Source of signal distortion. |
Refer to the graphic below for the following discussion:
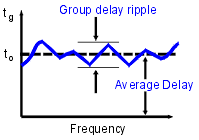
In a group delay measurement:
The linear phase shift component is converted to a constant value (representing the average delay).
The higher order phase shift component is transformed into deviations from constant group delay (or group delay ripple).
The deviations in group delay cause signal distortion, just as deviations from linear phase cause distortion.
The measurement trace depicts the amount of time it takes for each frequency to travel through the device under test.
Refer to the following equation for this discussion on how the VNA computes group delay:

Phase data is used to find the phase change (-df).
A specified frequency aperture is used to find the frequency change (dw).
Using the two values above, an approximation is calculated for the rate of change of phase with frequency.
This approximation represents group delay in seconds (assuming linear phase change over the specified frequency aperture).
Group Delay versus Deviation from Linear Phase
Group delay is often a more accurate indication of phase distortion than Deviation from Linear Phase.
|
|
|
Deviation from linear phase results are shown in the upper region of the following graphic: Device 1 and device 2 have the same value, despite different appearances. |
|
Group Delay results are shown in the lower region: Device 1 and device 2 have different values of group delay. This is because in determining group delay, the analyzer calculates slope of phase ripple, which is dependent on number of ripples which occur per unit of frequency. |
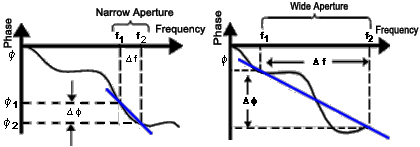
During a group delay measurement, the VNA measures the phase at two closely spaced frequencies and then computes the phase slope. The frequency interval (frequency delta) between the two phase measurement points is called the aperture. Changing the aperture can result in different values of group delay. The computed slope ( -delta phase / delta frequency) varies as the aperture is increased. This is why when you are comparing group delay data, you must know the aperture that was used to make the measurements.
Refer to the graphic below for the following discussion:
|
Narrow aperture: |
Wide aperture: |
|
Provides more detail in phase linearity. |
Provides less detail in phase linearity because some phase response averaged-out or not measured. |
|
Makes measurement susceptible to noise (smaller signal-to-noise ratio) and VNA phase detector resolution. |
Makes measurement less susceptible to noise (larger signal-to-noise ratio). |
Group delay measurements can be made using the following sweep types:
Linear frequency
List frequency sweep segment - The group delay aperture varies depending on the frequency spacing and point density. Therefore the aperture is not constant in segment sweep. In segment sweep, extra frequency points can be defined to ensure the desired aperture.
How to set Group Delay Aperture |
|
Using Hardkey/SoftTab/Softkey |
or
|
|
|
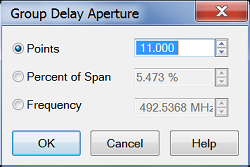
|
Although the Group Delay Aperture is defined as the difference in frequency between two data points (see What Is Aperture?), the group delay calculation can be averaged over many adjacent data points, similar to the VNA smoothing feature. The number of adjacent data points can be set using any of the following methods: Note: You can change the default Group Delay Aperture to two points using a VNA Preference. Learn how. Points Number of adjacent data points to average. Default setting is 11 points. Choose a value between 2 and the current number of points in the channel. Percent of Span The data points within this percentage of the current frequency span are averaged. Choose a value between (2 points / current number of points) and 100 percent. The span must contain at least two data points. Frequency The data points within this frequency range are averaged. The frequency range must contain at least two data points. When the frequency span or number of points is reduced so that the current Group Delay Aperture is NOT attainable, the Aperture is adjusted to the new frequency span or number of points. OK Applies setting changes and closes the dialog box. Cancel Closes the dialog. Setting changes are NOT applied. |
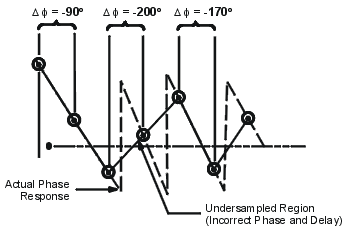
It is important to keep the phase difference between two adjacent measurement points less than 180° (see the following graphic). Otherwise, incorrect phase and delay information may result. Undersampling may occur when measuring devices with long electrical length. You can verify that the phase difference measured between two adjacent points is less than 180° by adjusting the following settings until the measurement trace no longer changes:
Increase the number of points
Narrow the frequency span
Electrical delay may also be used to compensate for this effect.
The frequency response is the dominant error in a group delay test setup. Performing a thru-response measurement calibration significantly reduces this error. For greater accuracy, perform a 2-port measurement calibration.
Particularly for an amplifier, the response may vary differently at various temperatures. The tests should be done when the amplifier is at the desired operating temperature.
Preset the analyzer.
If your DUT is an amplifier, it may be necessary to adjust the VNA source power:
Set the source power to be in the linear region of the amplifier's output response, typically 10 dB below the 1 dB compression point.
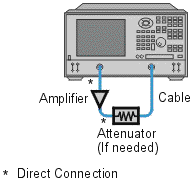
If needed, use an external attenuator so the amplifier output power will be sufficiently attenuated to avoid causing receiver compression or damage to the VNA port 2.
Connect the DUT as shown in the following graphic.
Select an S21 measurement.
Select the settings for your DUT:
frequency range
number of measurement points.
format: delay
scale: autoscale
Remove the DUT and perform a measurement calibration.
Reconnect the DUT.
Scale the displayed measurement for optimum viewing.
Use the Group Delay Aperture setting to increase the aperture, reducing noise on the trace while maintaining meaningful detail.
Use the markers to measure group delay (expressed in seconds) at a particular frequency of interest.
Print the data or save it to a disk.