CCDF Graph
The software has two locations for the CCDF graph: the Waveform Setup view and the Channel Setup view. In the Waveform Setup view, the CCDF graph shows the composite plot and peak-to-average values for all carriers. In the Channel Setup view, the CCDF graph shows the plot and peak-to-average values for the current carrier. This topic describes the CCDF functionality using the graph in the Waveform Setup view.
The CCDF graph displays the probability (in percentage) of the generated waveform's calculated peak-to-average power ratio (measured in dB) meeting or exceeding a certain level. The table to the left of the CCDF plot displays the calculated peak-to-average values for the current waveform. For additional information, see Understanding CCDF Curves.
Click  or
or  from the main
tool bar to generate an I/Q waveform and plot the
CCDF graph using the current channel configuration.
Any changes to the channel configuration setup do not appear on the graph
until you generate the waveform. The status
bar at the bottom of the screen shows waveform generation progress.
from the main
tool bar to generate an I/Q waveform and plot the
CCDF graph using the current channel configuration.
Any changes to the channel configuration setup do not appear on the graph
until you generate the waveform. The status
bar at the bottom of the screen shows waveform generation progress.
The CCDF and Waveform graphs
are minimized in the Waveform Setup node's initial view. To view the graphs,
click and drag the  border
above the CCDF and Waveform graphs.
border
above the CCDF and Waveform graphs.
Each time you adjust parameters and generate a waveform, a plot is added
to the graph.
The graph retains your three most recent plots (in shades of gray), allowing
you to make comparisons of waveform characteristics.
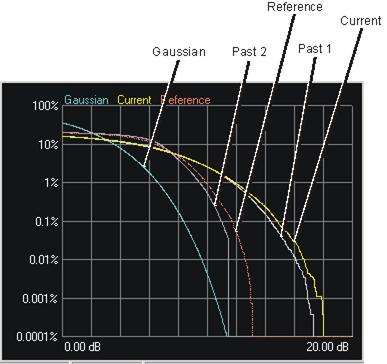
Use the buttons shown below to plot the Gaussian data, reference data and generated waveform data to the CCDF graph. The graph's initial state shows only the Gaussian curve (blue) until you generate a waveform.

Click to toggle the view of the band-limited Gaussian noise curve (blue).

Click to toggle the view of the reference curve (red). The reference appears as a flat line until you generate a waveform and click the button.

Click to make the current waveform curve (yellow) the reference curve (red). Click the button to view the reference curve.