Open topic with navigation
Waveform Graph
Click  or
or  from the main
tool bar to generate an I/Q waveform and plot four different waveform
graphs (Power, I+Q, I/Q, and Spectrum) in accordance
with the current channel configuration. Any changes to the channel configuration
do not appear on the graph until you generate the waveform. The status
bar at the bottom of the screen shows waveform generation progress.
from the main
tool bar to generate an I/Q waveform and plot four different waveform
graphs (Power, I+Q, I/Q, and Spectrum) in accordance
with the current channel configuration. Any changes to the channel configuration
do not appear on the graph until you generate the waveform. The status
bar at the bottom of the screen shows waveform generation progress.
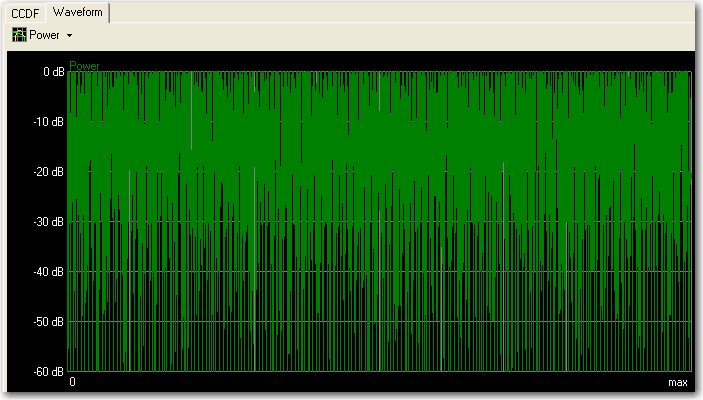
plot shows the cumulative power of the carrier configuration.
-
Select
in the , shown as follows.
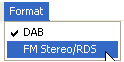
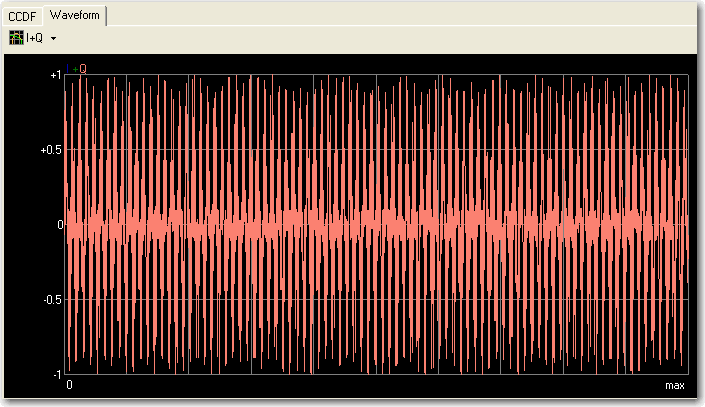
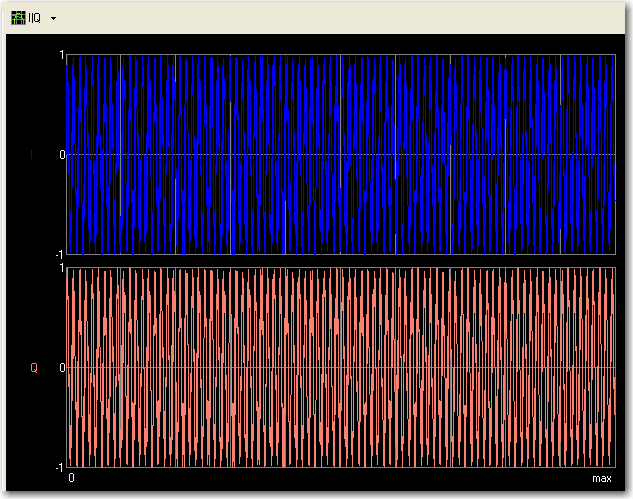
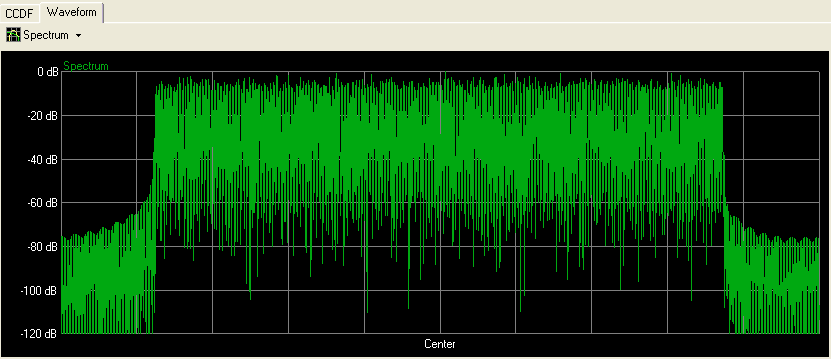
The waveform is as follows.
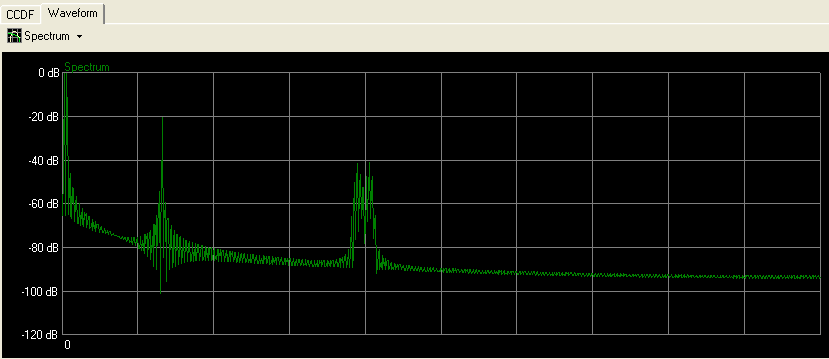
Click this button to select from the list
of different waveform plots. Selections include Spectrum (shown above),
 I+Q,
I|Q,
and Power.
Click the arrow to access a drop-down menu where you can make a direct
selection. Clicking the button selects the next plot type in the list
without displaying the menu.
I+Q,
I|Q,
and Power.
Click the arrow to access a drop-down menu where you can make a direct
selection. Clicking the button selects the next plot type in the list
without displaying the menu.
shows the I and Q components overlayed.
shows the individual I and Q components.
displays a composite of all the carriers.
-
Select in
the , shown as follows.
The waveform is as follows.
Click this button to select from the list
of different waveform plots. Selections include Spectrum (shown above),
I+Q,
I|Q,
and Power.
Click the arrow to access a drop-down menu where you can make a direct
selection. Clicking the button selects the next plot type in the list
without displaying the menu.
shows the I and Q components overlayed.
shows the individual I and Q components.
displays a composite of all the carriers.
The Waveform and CCDF graphs are minimized in
the Carrier node' s initial view. To view the graphs, click and drag the
border above the CCDF and Waveform graphs.
Related Topic
CCDF
Graph
Waveform
Setup