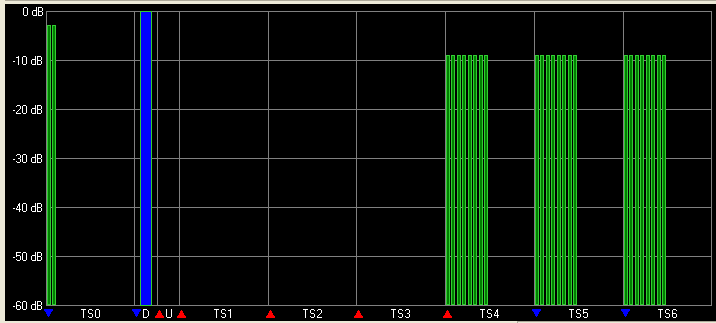

The code domain power (CDP) graph shows the power level of each code channel in each timeslot.
Click  or
or  from the main tool bar
to generate an I/Q waveform, then select a carrier (Basic or Advanced)
under Waveform Setup in the
  tree view
to view the normalized CDP distribution in accordance with the current
channel power configuration for that carrier at the bottom of the parameter
view window. In Basic mode, click on a timeslot in the common channel
setup table to view the Resource Unit
Setup for that timeslot.
Any changes to the channel or timeslot power configuration do not appear on the graph until you generate the waveform. The status bar at the bottom of the screen shows waveform generation progress.