Error Vector Time (802.16 OFDMA)
trace data shows the signal RCE Relative Constellation Error is the RMS level of the Error Vector Magnitude, averaged over all subcarriers and all detected OFDM symbols. (EVM Error vector magnitude (EVM): A quality metric in digital communication systems. See the EVM metric in the Error Summary Table topic in each demodulator for more information on how EVM is calculated for that modulation format.) vs. Time and frequency. It provides the individual symbol EVMs for each subcarrier, at each symbol, for all symbol-times within the defined analysis zone. Each symbol-time shows the symbol EVMs for all subcarriers in the defined bursts in the analysis zone (subcarrier 0 is not used). Inactive subcarriers may or may not be included, depending on the "Include active subchannels" selection. This trace data makes it easy to attain information about the signal modulation quality as a function of the symbol-times.
There is also a plot (white line) of the RMS average EVM at each symbol-time (includes all active subcarriers at that symbol-time for the defined analysis zone). This is same data and plot used in the RMS Error Vector Time trace data display.
Symbol EVM is the magnitude of the error vector difference between the measured symbol vectors (IQ Meas) and ideal symbol vectors (IQ Ref). RMS Error Vector Time trace data is the average of the symbol EVMs of all the subcarriers at each symbol-time.
The number of symbol-times included in the data results can be modified (or limitted) with the Override Measurement Region parameters.
Interpreting the trace data
The y-axis annotates the EVM magnitude and the x-axis annotates the OFDMA symbol number. The z-axis annotates the OFDMA subcarrier number (which includes subcarriers for the defined analysis zone, subcarrier 0 is not used). Each x-axis symbol-time on the trace data shows the individual symbol EVMs for all subcarriers at that particular symbol-time. Placing a marker on a symbol provides the symbol number, the burst name, the subcarrier number, the subcarrier symbol EVM and the RMS average of all subcarrier symbol EVMs at that particular symbol-time.
The trace uses a multi-color display to distinguish the various symbol data results including the analysis zone defined data burst symbols, the pilot subcarriers, and the RMS (average) EVM trace, see About Trace Data for more information.
Example Error Vector Time trace data: Demodulated IEEE Institute of Electrical and Electronics Engineers. A US-based membership organisation that includes engineers, scientists, and students in electronics and related fields. The IEEE developed the 802 series wired and wireless LAN standards. Visit the IEEE at http://www.ieee.org 802.16 OFDMA signal with a result length of 8 symbol-times (1 through 8).
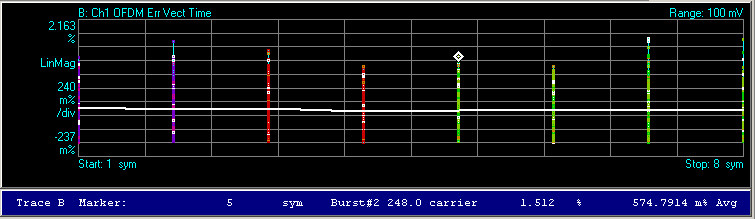
Trace B: Ch1 OFDMA trace data indicators:
-
Multi-color Squares: Identifies the data subcarrier symbol EVMs (various colors).
-
White squares: Pilot subcarrier symbol EVMs.
-
Vertical lines: Identifies common OFDM Orthogonal Frequency Division Multiplexing: OFDM employs multiple overlapping radio frequency carriers, each operating at a carefully chosen frequency that is Orthogonal to the others, to produce a transmission scheme that supports higher bit rates due to parallel channel operation. OFDM is an alternative tranmission scheme to DSSS and FHSS. Symbol-times.
-
White line: Plot of the RMS average subcarrier symbol EVM at each symbol-time. This is the same trace data as the OFDM RMS Error Vector Time trace data.
-
White diamond: Identifies the marker position.
Trace B Ch1 OFDMA Error Vector Time Trace Data, Marker Readout:
-
Symbol-time number: 5
-
Burst Name: Burst#2
-
Subcarrier number: 248 (subcarrier 0 is not used)
-
Subcarrier Symbol EVM: 1.512 % (for subcarrier 248, symbol 5)
-
RMS average symbol EVM: 574.7914 m% Avg (for all subcarriers at symbol 5)
See Also