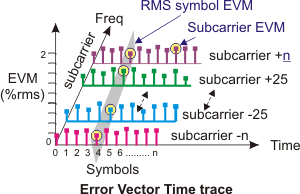
Error Vect vs. Sym (Carrier overlay) (Custom OFDM)
trace shows the value of the error vector for each point in the OFDM Orthogonal Frequency Division Multiplexing: OFDM employs multiple overlapping radio frequency carriers, each operating at a carefully chosen frequency that is Orthogonal to the others, to produce a transmission scheme that supports higher bit rates due to parallel channel operation. OFDM is an alternative tranmission scheme to DSSS and FHSS. time-frequency grid (subcarrier x OFDM symbol). The value shown is usually EVM Error vector magnitude (EVM): A quality metric in digital communication systems. See the EVM metric in the Error Summary Table topic in each demodulator for more information on how EVM is calculated for that modulation format., but you can also choose other Trace Formats.
The x-axis unit is OFDM symbol and the overlay unit (z-axis) is subcarrier. In addition to the individual points drawn on the trace, there is an average line (white by default) that shows the RMS average for each x-axis location (over all z-axis points for that x-axis location).
The error vector data is computed by subtracting the IQ Ref data from the IQ Meas data.
For MIMO Multiple Input, Multiple Output: A physical layer (PHY) configuration in which both transmitter and receiver use multiple antennas. signals, there is a separate trace for each spatial stream.
You can limit the number of OFDM symbols included in the trace using the Measurement Interval and Measurement Offset parameters.
Carrier phase drift will show up in the Error Vect vs. Sym trace, and not in the Common Pilot Error trace when Track Phase is cleared. Carrier phase drift will show up in the Common Pilot Error trace, but will be mostly removed from the Error Vect vs. Sym trace when Track Phase is selected.
Trace Color coding Scheme
A multi-color coding scheme is used to make it easy to visually identify common symbols, subcarriers, and data results within various OFDM Traces. This makes cross trace data comparisons and analysis easy to accomplish. Different colors are assigned to symbols representing a common subcarrier type including: Preamble, Pilot, Data, and Null subcarrier types. Some common color scheme Traces include: Error Vect vs. Carrier, Error Vect vs. Sym, IQ Meas, OFDM Data Burst Info, and Symbols trace data.
You can also customize and re-assign Trace colors schemes, see the Display Preferences Color tab (click tab and select a new color for the active Mod Type element).
Markers
When you place a marker on the data, the marker readout (shown above the trace or in the Markers window) will show several fields. Here is an example where the trace format is LinMag.

This indicates that Marker 1 is located on OFDM symbol 4, subcarrier -1585. The EVM at this point is 0.268% and the RMS EVM over all subcarriers for symbol 4 is 0.110%.
Overlay Information
Here is an illustration of the data shown in this trace, expanded along the z-axis (subcarriers) so that you can more easily see the points that are overlaid on the trace displayed in VSA.
Inputs to Error Vector Calculation
The following illustration shows how the Error Vector values are computed.
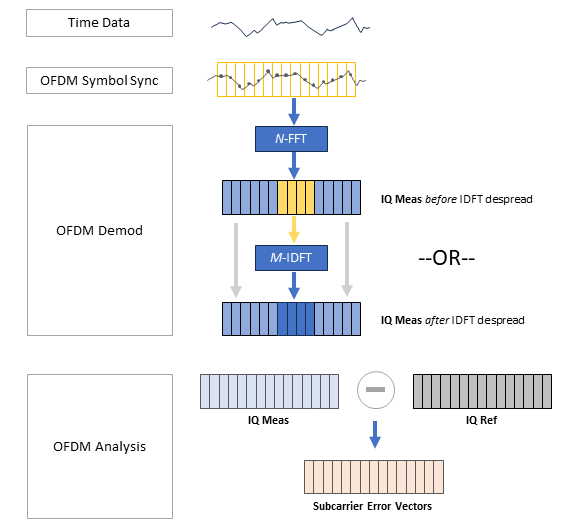
The error vector calculation is simply the subtraction of the expected values (IQ Ref) from the measured values (IQ Meas). The IQ Meas and IQ Ref input to the calculation depends on the trace data. IQ Ref data always follows the same pattern as IQ Meas. Here is how IQ Meas is determined for the various Error Vector traces.
|
Error Vect vs. Carrier (Sym overlay) |
DFT spreading is active for payload data when Multiple Access Scheme = DFT-S-OFDM, and for pilots when Pilot In Time Domain is enabled. |
|
IQ Meas is the time data that is the input of the N-point OFDM symbol FFT. There are the same number of samples as there are subcarriers, but the data is the OFDM symbol FFT points before the FFT is taken. |
The illustration above mentions IQ Meas before and after IDFT inverse discrete Fourier transform despread, for purposes of computing the Error Vector data, but the IQ Meas trace always shows IQ Meas after IDFT despread, regardless of the DFT-S-OFDM Err Vector Traces parameter.
See Also
Available Trace Data (Custom OFDM)