About Frequency vs. Time Measurements
Frequency Versus Time measurements are conceptually similar to Time Versus Time measurements, except that the notion of fast time has been replaced with frequency. So the x-axis is frequency, the y-axis is slow time and the color represents the power at that frequency and time. To create this heat map representation, the VSA will take the current acquisition's time data, split it into overlapping slices, perform a windowed FFT Fast Fourier Transform: A mathematical operation performed on a time-domain signal to yield the individual spectral components that constitute the signal. See Spectrum. on each block, and use these blocks to compile spectrum displays as color-coded heatmaps or an averaged spectrum.

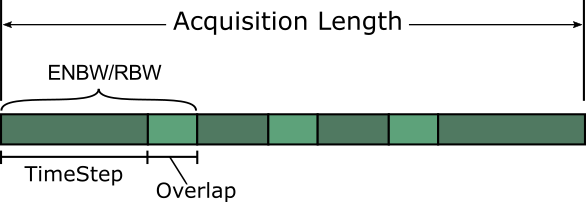
The vertical, or y-axis, is determined by the capture length of the signal. The length of each slice, in the horizontal dimension, is determined based on ENBW/RBW Resolution Band Width (RBW or ResBW): specifies the minimum frequency bandwith that two separate frequency spectra can be resolved and viewed seperately. For FFT (digital) based VSA's the process is equivalent to passing a time-domain signal through a bank of bandpass filters, whose center frequencies correspond to the frequencies of the FFT bins. For a traditional swept-tuned (non-digital) spectrum analyzer, the resolution bandwidth is the bandwidth of the IF filter which determines the selectivity., where ENBW is the Equivalent Noise Bandwidth (derived from the signal), and RBW is specified by the MeasSetup > Frequency vs. Time > ResBW parameter. This setting is specifically used for the Frequency vs. Time analysis feature, which has no effect on hardware acquisition, and is not the same as the MeasSetup>ResBW> parameter.
The TimeStep parameter determines how much to step forward in time before grabbing the next slice of input time domain data. Therefore, this must be less than the time length of the x axis, and will achieve an overlap in the slices (Overlap = TimeLen - TimeStep, where TimeLen is the time length for the measurement shown on the trace). The Window Type is used for the FFT's that are performed by the Freq v Time Heatmap trace.
The Time v Time Heatmap and Freq v Time Heatmap traces process and draw a single acquisition worth of data. Every acquisition brings in new data that is drawn, and the old data is disposed.
See Also
