Multi-Measurement Theory of Operation
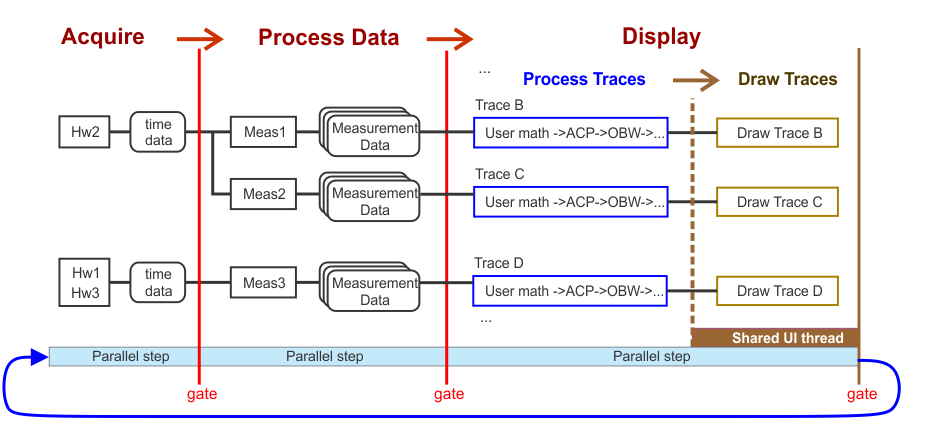
The VSA multi-measurement implementation consists of three basic processing steps:
- Acquire the input data
- Process the data
- Display trace results.
Multi-Measurement Configuration
A multi-measurement configuration is defined by a collection of measurements and their settings. For each measurement in a multi-measurement configuration, there is a set of parameters for each measurement (measurement setup) that defines how the measurement runs. These parameters include hardware connections, input channels, time record length, recording file, center frequency, span, ResBW, averaging, demodulator properties, trace data, and others. Global VSA settings are not included in measurement parameters (Source settings, display preferences, trace layout, etc.).
Each measurement's setup is independent from the others. However, when multiple measurements share the same Analyzer Configuration in the Synchronous Acquisition Mode, their parameters relating to hardware (center frequency, span, time-record length, triggering, etc.) are constrained relative to each other. All other parameters can be set differently for each measurement. In Sequenced Acquisition Mode, there are no constraints with hardware settings between measurements using the same hardware.
For information about using the 89600 VSA user interface to configure multiple measurements, see the Managing Multiple Measurements topic.
Since measurements reside in memory, the number of measurements is limited by the amount of memory available to the VSA process.
Multi-Measurement Process
Measurements that run concurrently are gated, meaning all measurements must complete one process step before moving to the next process step (i.e. measurements do not run asynchronously or update the traces at different rates). There are three main steps in the VSA measurement process:
- Acquire - time records are collected from Analyzer Configurations in parallel or in a sequence.
- Process Data - time records are analyzed by measurements in parallel
- Display - trace information is calculated in parallel and shown in traces
- Process Traces - trace information (user math, stimulus/response graph, ACP Adjacent Channel Power: The power from a modulated communications channel that leaks into an adjacent channel. This leakage is usually specified as a ratio to the power in the main channel, but is sometimes an absolute power., OBW Occupied bandwidth is closely related to channel power. It indicates how much frequency spectrum is covered by some given percentage (often 99%) of the total power of the modulated signal., spectrograms, etc.) is calculated from measurement data
- Draw Traces - trace information is drawn as it becomes available
For each measurement process step, the VSA waits until all operations are complete for all measurements before starting the next step.
 The following sections describe the measurement process in more detail.
Acquire
Time records are acquired for measurements in parallel or in sequence. When the Acquire step begins, all the Analyzer Configurations are configured and data capture occurs in parallel or in sequence. The time records from multiple Analyzer Configurations have various levels of synchronization.
Measurements can be configured to share a time record or acquire multiple time records from the same Analyzer Configuration or to use time records from different Analyzer Configurations. See the Acquisition Modes and Concurrency section of the Multi-measurement Overview for more information.
To improve synchronization/time alignment of the time data captured from different measurement hardware, see the Trig Out parameter in the dialog.
Process Data
When the time records are available, the VSA transitions to the Process Data step where Measurement Data is computed for each of the measurements.
All measurements are processed in parallel on multiple cores. The Process Data step includes operations such as resampling, FFT Fast Fourier Transform: A mathematical operation performed on a time-domain signal to yield the individual spectral components that constitute the signal. See Spectrum., demodulation, and calculation of summary information (EVM Error vector magnitude (EVM): A quality metric in digital communication systems. See the EVM metric in the Error Summary Table topic in each demodulator for more information on how EVM is calculated for that modulation format., Frequency Error, etc.).
The optimal number of measurements is (Number of CPU cores - 1). Note that many of the measurements make use of multi-threaded comput ations, so the optimal number of CPU cores is larger.
To increase measurement speed, the VSA only calculates results that are needed for traces or for MeasurementData results that have been marked by the user to be calculated.
Display
When the Process Data step is completed, the VSA starts the Display step, which computes trace information and draws the trace outputs.
The Display step has two operations: Process Traces and Draw Traces. During Process Traces, trace-specific data is calculated for each Measurement Data including User Math, ACP, OBW, Trace Average, and Limit Lines. Computations in Process Traces operation are performed in parallel with respect to other traces, instead of measurements as in previous steps.
As trace information becomes available, the trace is drawn. During the Draw Traces operation, an additional trace transformation is performed based on the trace format and other trace settings such as scaling and ranges.
Recordings with a Shared Analyzer Configuration
A measurement's input time data can come from hardware or a recording file. When you recall a recording into a measurement, the recording is copied to a temporary recording file. Each measurement has a separate, temporary recording file.
When several measurements are configured for Shared Acquisition and the input data source is set to Recording, the measurements in the shared acquisition group share the recording file of the first measurement in the group. The first measurement is the one listed at the top of the group in the Measurements dialog.
See Also
Enhancing the Measurement Speed
