Beam Pattern (5G NR/5G-Advanced)
There are two types of traces in the Trace > Data > Demod and MIMO Multiple Input, Multiple Output: A physical layer (PHY) configuration in which both transmitter and receiver use multiple antennas. menus that display component carrier data: CCn (component carrier is fixed), and Selected Display CC (component carrier is dynamically selected using the Display parameter). See About Per-Carrier Trace Types for more information.
3D traces require a minimum OpenGL version of 2.1 to be enabled for proper three-dimensional rendering.
The trace shows a three-dimensional simulated representation of all available beam patterns in the system, including all layers, antenna groups, and users.
The Beam Patterns trace simulation is computed based on the model of the element radiation pattern configured by the Antenna Pattern properties group along with the physical antenna layout map that is configured using the Antenna Layout properties, and the Beam Weights trace data.
To locate the beam peak of a specific user from the Beam Peaks trace on the Beam Pattern trace, place a marker at the peak on the Beam Pattern trace and adjust it until the Azimuth and Elevation angles correspond to the Beam Peaks trace for that user (see illustration below).
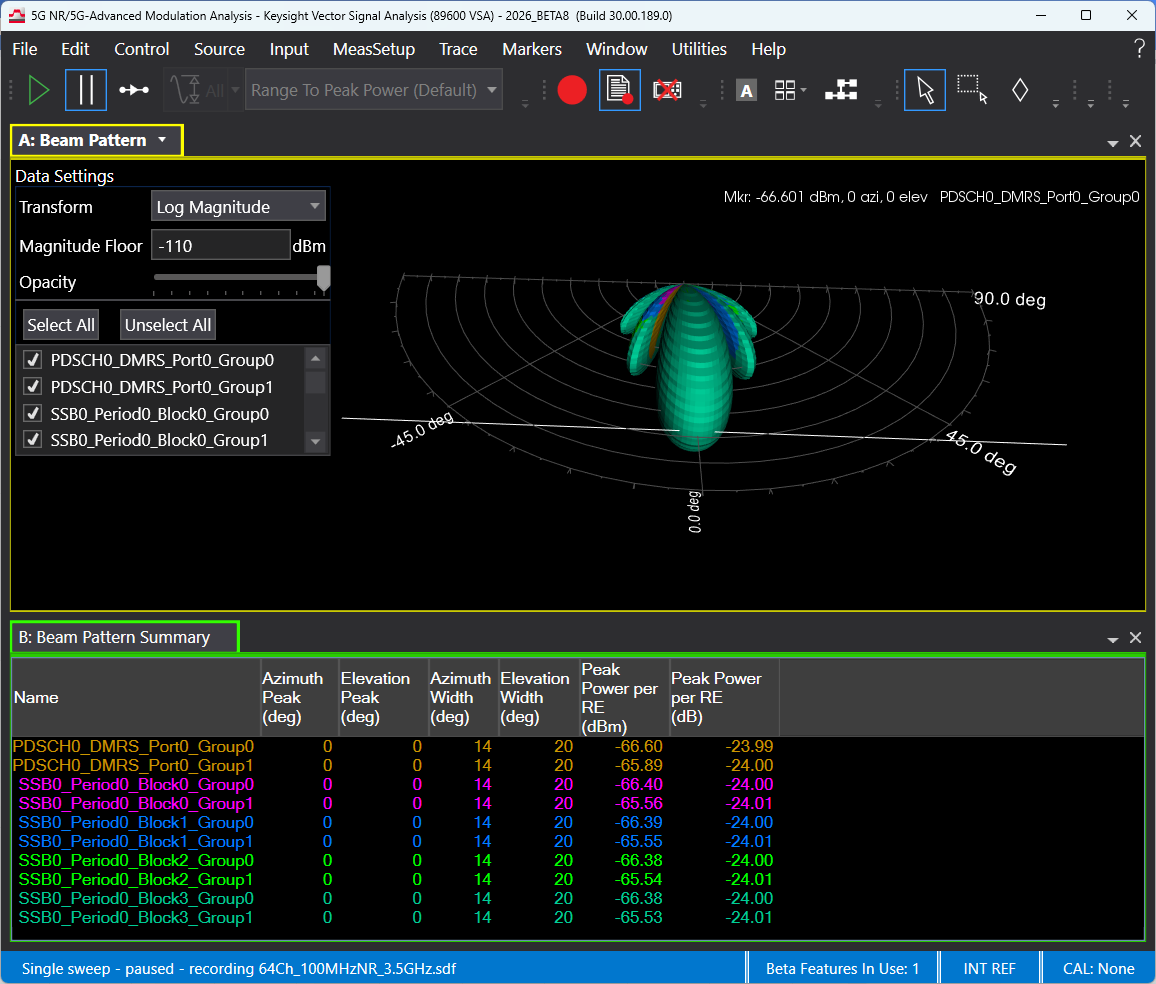
The following 3D plot shows the beam patterns of all active physical channels, selected in the Beam Patterns Include parameter group. In this example, it includes PDSCH Physical Downlink Shared Channel and four SSB blocks, each with dual-polarization where Group 0 corresponds to polarization 1 and Group 1 corresponds to polarization 2.
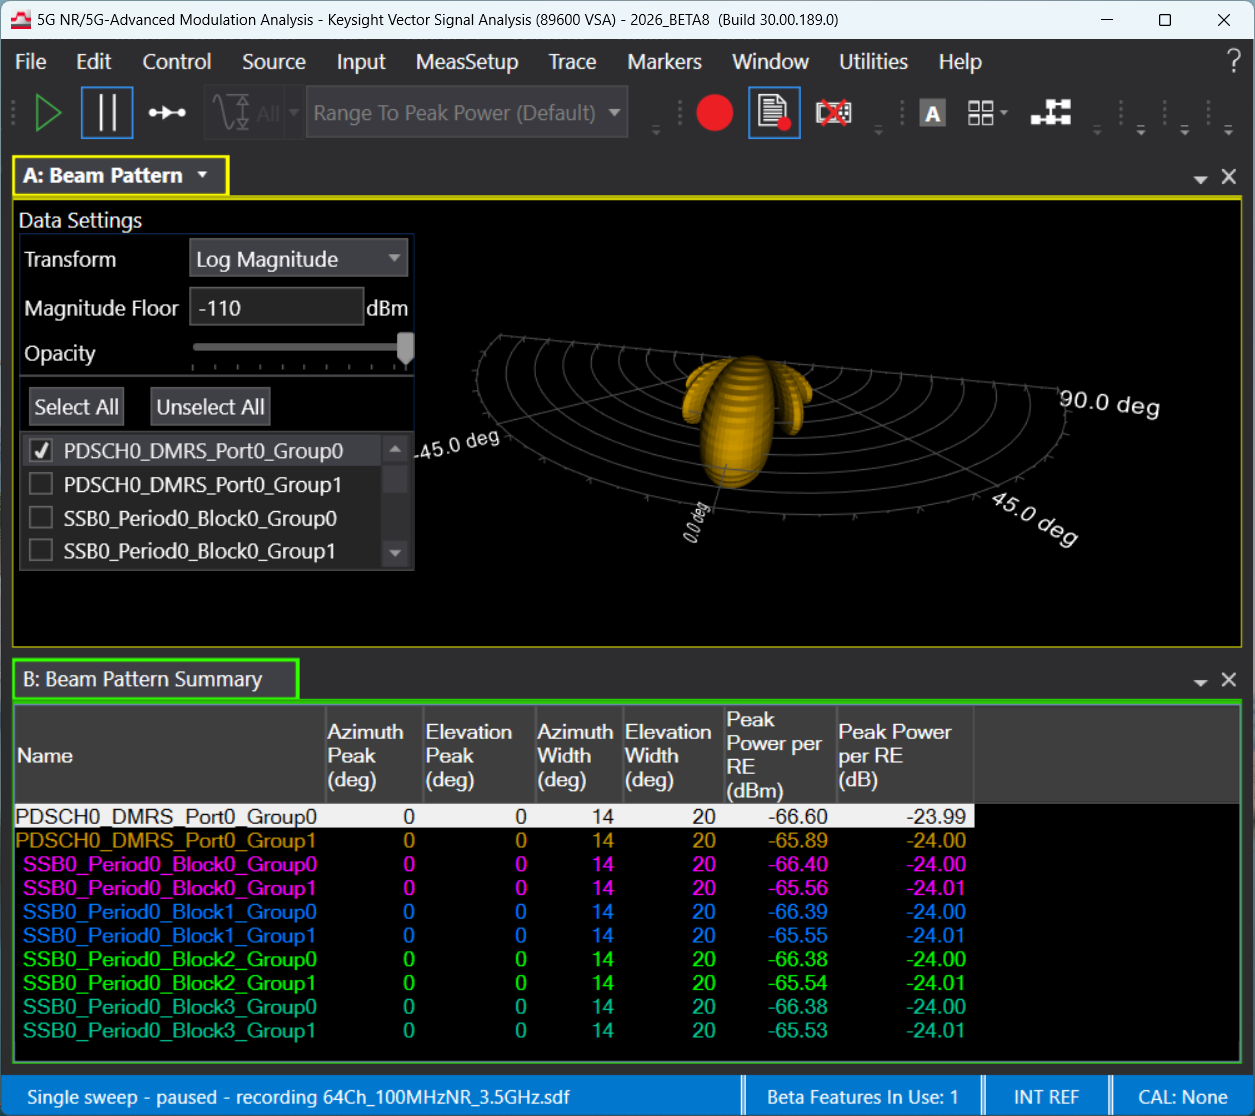
By default, the plot overlays all beams and polarizations in a single 3D view, providing a complete visualization of the overall radiation pattern. Users can refine the display by choosing which physical channel to view and, in the case of dual-polarization, selecting a specific polarization group.
The following image shows an example of only viewing the 1st polarization of PDSCH.
Data Settings
Data Settings allow you to adjust how data is transformed and presented in the trace. To adjust data settings, hover over the text in the upper left corner of the trace and click on the text.
Data settings are only available on the GUI, and are not configurable through the API 1) Access Preamble Indicator, or 2) Application Programming Interface.
Transform - Select the coordinate transform to be applied to the data before it is drawn.
- Log Magnitude: Specifies a logarithmic scale for the beam magnitudes. Magnitude is represented in dB, when Log Magnitude is selected.
- Linear Magnitude: Specifies a linear scale to be used for the beam magnitudes. Magnitude is represented in V, when Linear Magnitude is selected.
Magnitude Floor - The floor sets a minimum value to clip magnitude values to. The floor value is also used to set the origin of the polar plot. All values below the magnitude floor are clipped and set to the magnitude floor for displaying the data.
Opacity - Drag the slider to adjust the transparency of the drawn data. This can be useful to reveal data hidden by collisions.
Select All - Selects all physical channels to be included in the 3D plot. The channels that appear in the list are selected in the Beam Patterns Include parameter group.
Unselect All - Selects no physical channels to be included in the 3D plot.
See Also