
IMPORTANT:
To use this feature you must have Data Link version 7.0 or greater. If you do not have the correct version of Data Link, download the Data Link software from www.keysight.com/find/fieldfox.
NOTE: DANL is used only with RTSA, and SA modes. ALL OTHER MODES ARE NOT SUPPORTED. DANL is only available when used with FieldFox firmware version A.12.5x and above. |
This topic assumes you are familiar with: Open and Save Files, Record Playback Trace Recording Tool (Command Line Help, Creating Session Folders Data), Viewing Playback Data, and Setup LAN Instrument.
In this topic:
Learn how to use the DANL feature using SA and RTSA modes.
NOTE: It is recommended that you review the UI Features, Menu Bar, and Status Bar sections, before using the Procedure.
NOTE: Recorded measurements from the FieldFox are required to be used with the DANL tool.
The DANL feature displays recorded SA and RTSA Spectrogram, spectrum, spectrum sequences, density or combined measurements.
NOTE: For information on how to use the FieldFox's Record/Playback features to create *.sta files, refer to the FieldFox Chapter 18/19 Interference Analyzer (SA Mode) - Option 236 and Chapter 9/10 RTSA (Real-time Spectrum Analyzer Mode- Option 350) A-Series N9927-90020, the B-Series N9938-90006, and A-Series N9915-90020 (Unabridged) User's Guides.
NOTE: It is recommended that you review the UI Features, Menu Bar, and Status Bar sections, before using the Procedure.
NOTE: To learn more about opening DANL AutoSession files or if you want to convert session playback file to a *.csv, refer to Open and Save Files.
Suggested Settings:
Positive Peak Detector
RBW 1 kHz (i.e., without preamplifier)
Attenuator 0 dB
Without external offset
1. On the FieldFox: Create an Autosession (n) /10 (.sta) session file by:
Using the FieldFox A-Series N9927-90020, B-Series N9938-90006, or C-Series N9915-90020 (Unabridged) User's Guides or
Saving a file as a AutoSession file to an *.sta file. Refer to Open and Save Files.
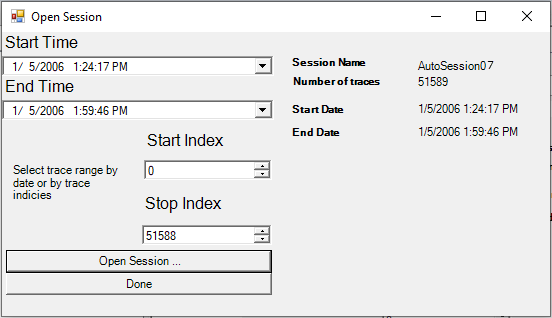
2. On the Menu Bar, click Tools > Playback > Open Binary Session to select your Autosession (n) (*.sta) to open in Data Link: Click File > Open... > Autosession02 (example)
Refer to Figure 1.
Click Open Session... (See figure 2).
Click Done. Learn more, see Open and Save Files.
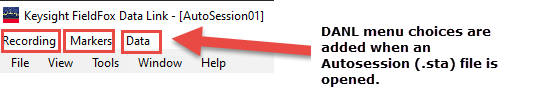
NOTE: The DANL Tools Menu appears above the standard Data Link Tools Menu.
Then choose from the following:
Click on Markers and set up markers and delta markers.
Click on File > Preferences... and use the Preferences Dialog Box to change the range of the Zoom In/Out mouse behavior.
Zoom In/Out using the Waterfall pane and your left mouse but or scroll wheel to drag up or down. See DANL Display - Density, Spectrogram, and Waterfall View (And Waterfall Mouse Behavior).
Click on File > Load /Save to load or save a data link saved (.dls) file to save your data and marker choices.
Learn more by referring to DANL UI Features and DANL Tools Bar Features.
DANL Display - Density, Spectrogram, and Waterfall View (And Waterfall Mouse Behavior)
After clicking Done, the DANL menu that appears above the standard Data Link menu (Refer to Figure 4):
Display - Density, Spectrogram, and Waterfall View Features
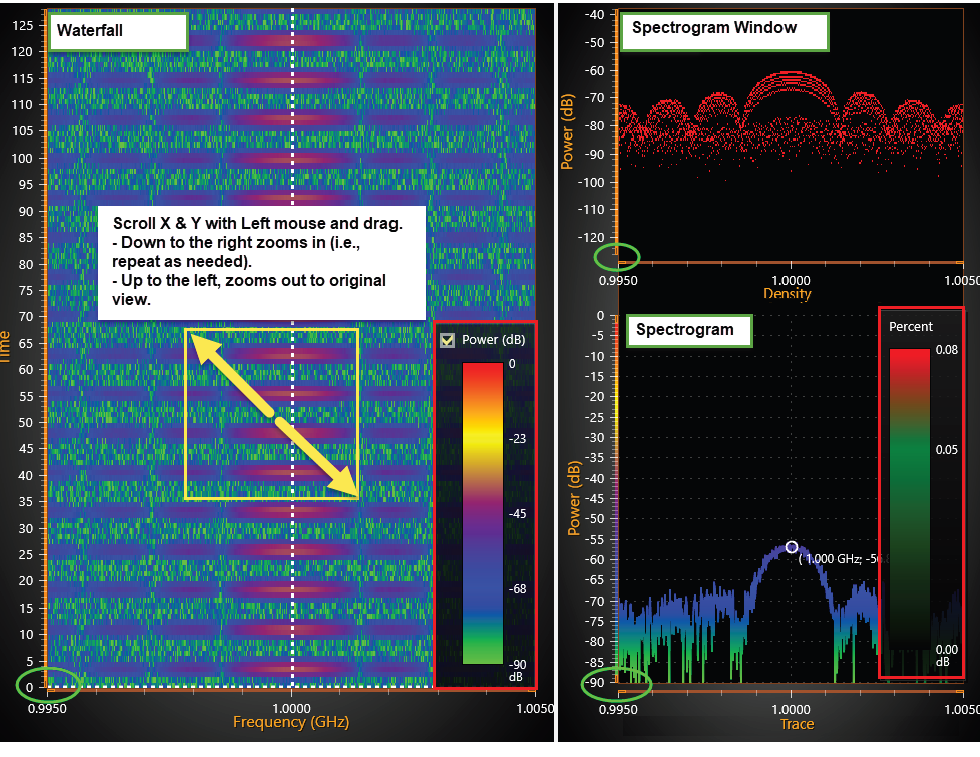
Zoom In/Out (See Figure 5 below)
Use your mouse to the change view (See also, Icon Descriptions):
NOTE: Mouse wheel can be used to Zoom In/Out..
Zoom In - Left click drag down to right. Zooms the Waterfall and Spectrogram panes, but does not affect the Density pane.
Zoom Out - Left click drag up to left corner. Returns Waterfall pane to originally displayed view, before zooming in.
Power (dB) Gauge - Indicates the color gradient of minimum to maximum power. Enables of disables the Waterfall data. Power gauge may be moved to anywhere in the data view using the left mouse click.
Percent Gauge - Power density/spectrum percentage. Percent gauge may be left mouse moved to anywhere in the data view.
NOTE:
- You can only Zoom In/Zoom Out in the Waterfall data pane and the effect can be seen in the Spectrogram and Density panes.
- Mouseover the figure below and click to go to descriptions in this topic.
This section contains the following:
NOTE: "Save..." is only active when Data > Copy data has been used to create a copy of the current AutoSession (n). See also, Data.
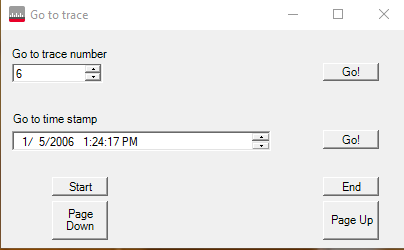
Go to trace number - Enter a trace number from 0 to n to view. Then click Go! button to go to trace number.
Go to time stamp - Enter a time stamp for the displayed trace to view. Then click Go! button to go to time stamp.
Start - this button moves the dashed-white vertical line to the start of the current DANL signal
End - this button moves the dashed-white vertical line to the end of the current DANL signal
Page Down - Starts playing the DANL signal from the end.
Page Up - Starts playing the DANL signal from the beginning.
NOTE: The Report dialog box auto-populates: Data Source, Number of Points Per Trace, Resolution Bandwidth, Video Bandwidth, Center Frequency, and Span information.
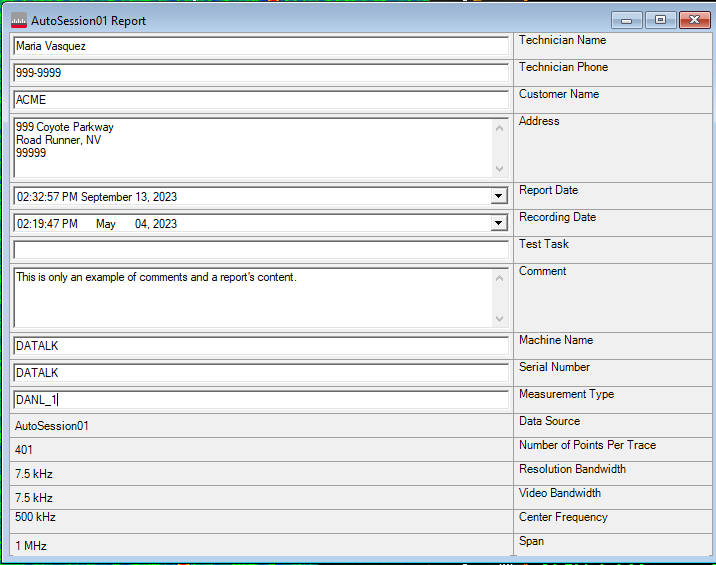
NOTE: When you close the Report window, the data is cleared.
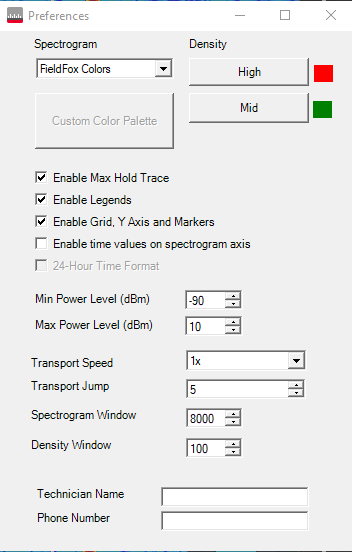
Click on the Density buttons: High and Mid (Middle) to change the colors on the power levels.
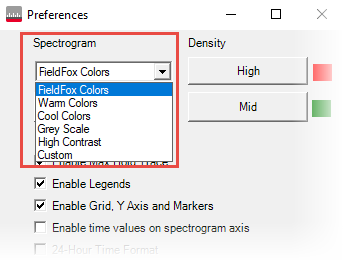
Click on the Spectrogram (colors) drop down box and choose from:
FieldFox Colors (default) - Enables the colors that are available on the instrument.
Warm Colors
Cool Colors
Grey Scale
High Contrast
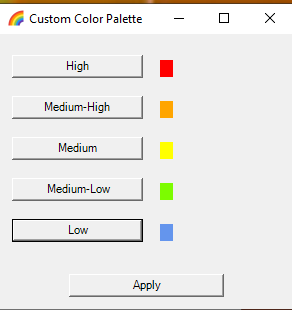
Custom - Opens a Custom Color Palette window that enables you to choose your own colors and to additional levels of power level colors (i.e., Medium-High, Medium, Medium-Low, and Low).
Click Apply to enable color changes to Spectrogram trace.
Click to Enable Max Hold Trace to enable/disable the maximum hold trace on the Density trace.
Click to Enable Legends to enable/disable the displayed Power (dBm) and Percent (dBm) legends.
Click to Enable Grid, Y axis and Markers.
Click to Enable time values on spectrogram axis (i.e., number of traces is the default displayed Y-axis values).
NOTE: 24-Hour Time Format is only active when Enable time values on spectrogram axis is checked.
Click on 24-Hour Time Format to enables/disables 24 hour to 12 hour time-format or vice versa (default == 12 hour).
Click on Min Power Level (dBm) to set the minimum power level (up to -150 dBm).
Click on Max Power Level (dBm) to set the minimum power level (up to 150 dBm).
Click on Transport Speed during Playback to down arrow to select 1x, 2x, 5x, or 10x (default == 1x).
Click on Transport Jump Reverse and Forward to 1 to 32767 (default == 5).
Click on Spectrogram Window to change to increase /decrease the information displayed in the Spectrogram pane (1 to 8000, default == 8000, not settable).
Click on Density Window to change to increase /decrease the FFT window overlap to reduce side lobes of the information displayed in the density pane (1 to 8000, default == 100).
NOTE: 24-Hour Time Format is only active when Enable time values on spectrogram axis is checked.
Click in the Technician Name box and enter the technician making the measurement.
Click in the Phone Number box to enter contact information on the technician.
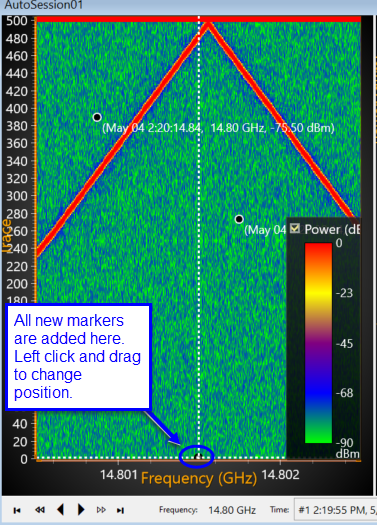
Add - Clicking Add creates a marker at the intersection of the X and Y axis white dashed lines. But, if the X-axis dashed line is in the default position at the bottom of the Waterfall image as shown in Figure 9, Figure 10, and Figure 11 then the marker is displayed in the center of the Y-axis dashed line.
Delete - Click to select the marker and then Delete.
NOTE: You can delete the default initial marker at the bottom center of the displayed data.
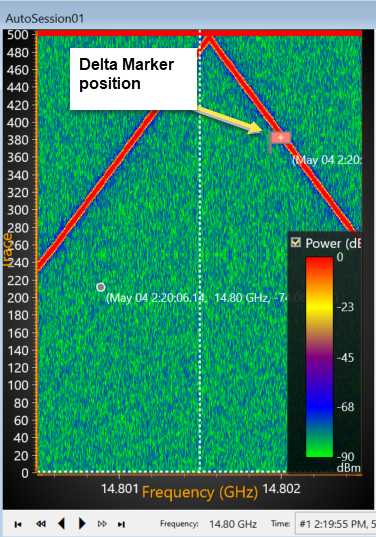
Set delta -
Clear delta - Deletes the currently selected delta marker value (i.e., use left mouse to select).
To create a delta marker left:
Peaks - Opens a PeakSearch dialog box to choose: Peak Left, Peak, Peak, Right, or Cursor to Center.
This table describes the different types of delta marker icons that are used in the DANL feature.
To select a delta marker you must have two markers displayed click the marker you want to be the delta marker and:
NOTE: You can only have one active (selected) delta marker (orange) and one black delta marker at the same time. Attempting to set a third delta marker clears the other two delta markers.
Delta Flag Type |
Description |
|
|
| Solid white or gray/white flashing icon indicates the current delta marker has been reselected and needs to be confirmed by clicking. | |
| Gray delta marker with icon indicates another marker has been clicked and the delta marker is in the process of being reset. Click Markers > Set Delta Marker to make this the active delta marker. | |
| Black delta marker indicates a second delta marker is currently selected . |
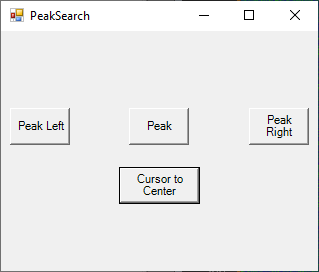
Click Peak Left, Peak, or Peak Right to select the nearest peak power point.
Note: If there is not Peak Left or Peak Right data point, the white-dashed vertical bar indicates the new peak power position.
Procedure for Restoring copy lines to a session and Deleting last selected pair
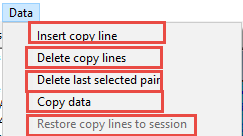
Insert copy line - Add a copied initial line to define the Waterfall data area. Two copied lines are required to define the Waterfall data area. to be copied See also, Copy data.
Delete copy lines - Deletes all inserted copy lines.
Delete last selected pair - Click a AutoSession (n) copy, click Data > Data delete last selected pair,
Refer to "Procedure for defining a Waterfall area..."
Copy data - Copy an initial Waterfall data area defined by a pair of copy lines.
Restore copy lines to session - This activates the previously copied area of the AutoSession (n) that was defined by a pair of copy lines and enables editing of those copy lines.
Note: Activated area defined by a pair of copy lines is visible in the AutoSession (n) displayed data and is indicated by a change in the color of the copied lines.
See also, Opening a *.dls File.
NOTE: Learn more, refer to Example - Insert Copy Lines.
Reverse /Play /Forward - To move the Waterfall data in time. The speed and amount of the Reverse /Forward time changes are set in the Preferences Dialog Box.
Frequency - Is the Center frequency of the current *.csv file that is loaded into Data Link.
Delta - Is the value of the current delta marker displayed in the Waterfall pane.
NOTE: If you have a delta marker visible on the display, but no delta marker value is displayed in the bottom right corner (see )
 - indicates mouse pointer is
near an area of the image that can be changed via left mouse click and
drag.
- indicates mouse pointer is
near an area of the image that can be changed via left mouse click and
drag.
 -
Horizontal scroll left mouse drag. Available at the bottom left side of
the Waterfall, Density, and Spectrum panels.
-
Horizontal scroll left mouse drag. Available at the bottom left side of
the Waterfall, Density, and Spectrum panels.
 -
Vertical scroll left mouse drag. Available at the bottom left side
of the Waterfall, Density, and Spectrum panels.
-
Vertical scroll left mouse drag. Available at the bottom left side
of the Waterfall, Density, and Spectrum panels.
![]() - Use the left mouse cursor
and this double arrow with a vertical
bar marker to move the Waterfall pane's X and Y axis white dashed
lines.
- Use the left mouse cursor
and this double arrow with a vertical
bar marker to move the Waterfall pane's X and Y axis white dashed
lines.
Date Last Modified:
aug2023 |
Updated content (7.5x) |
july2022 |
Added new topic |
