Use the Directional-Finding's Graph tab to view the Time Series Results, Spectra Results, Correlation Results, or Time Series Details from the acquisition.
Measurement Setup (Same as Directional-Finding (Graph and Map) Screen Features)
Acquisition Control (Same as Directional-Finding (Graph and Map) Screen Features)
Measurement Status (Same as Directional-Finding (Graph and Map) Screen Features)
Refer to the following Directional-Finding types for more details:
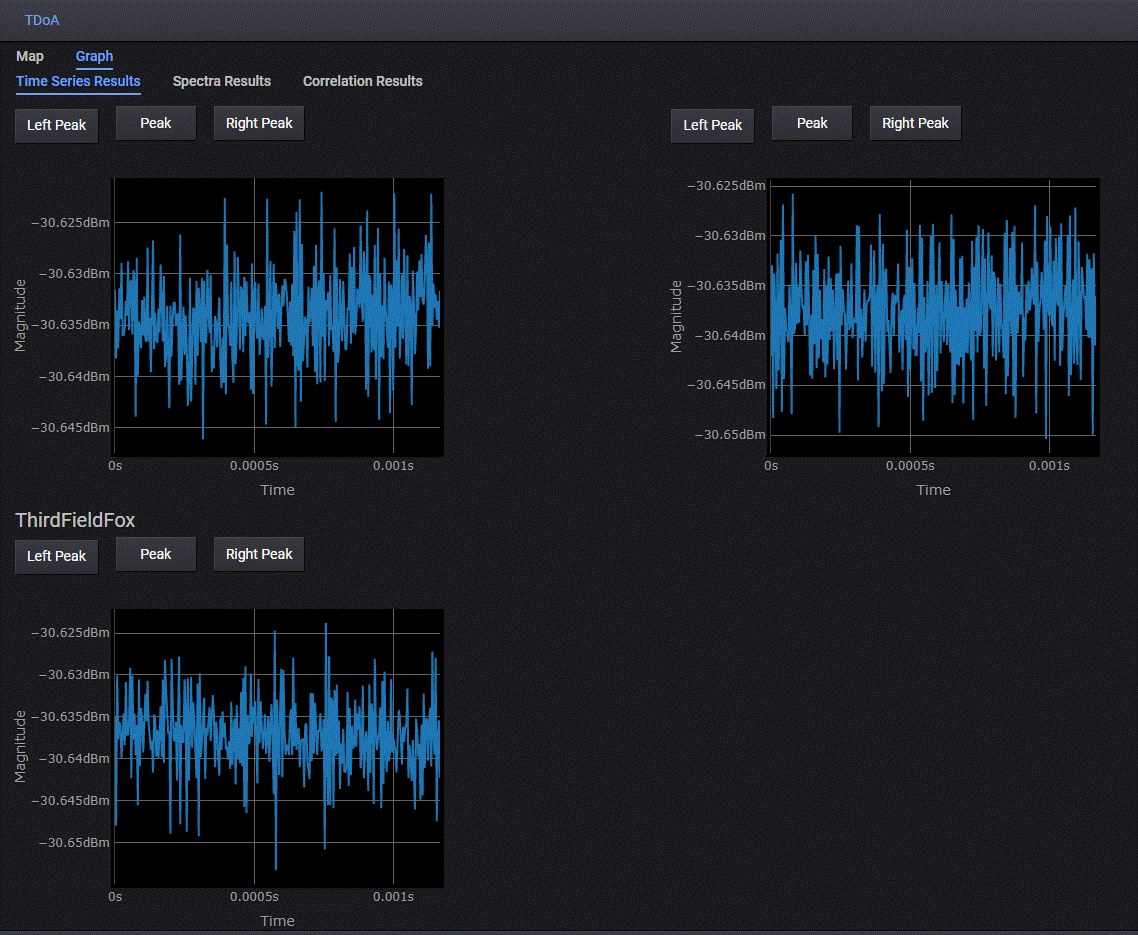
The Time Series Results tab displays left peak, peak, and right peak data in magnitude vs. time data for the receivers that acquired the current target's data.
NOTE: A minimum of three receivers are required for a TDoA measurement.
Figure 1. Time Series Results Graphs
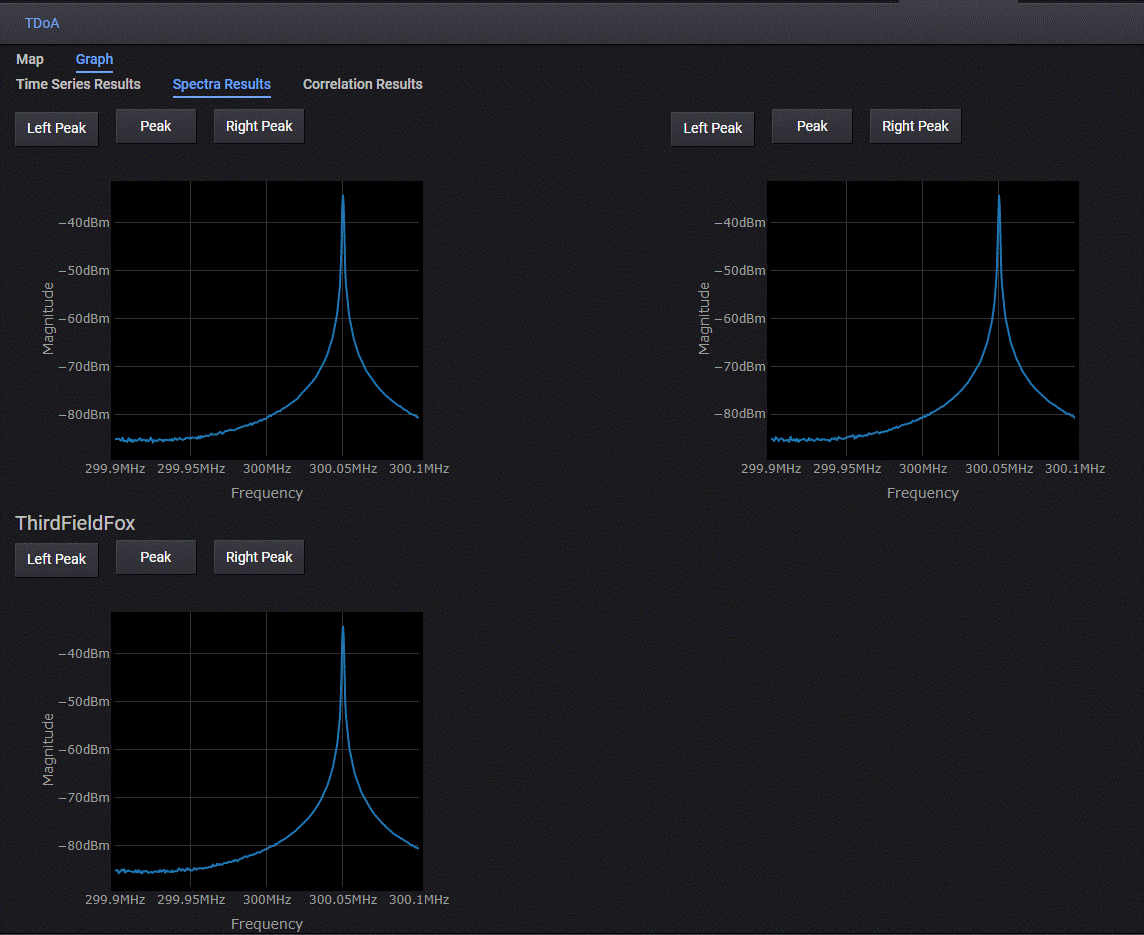
The Spectra Results tab displays the spectrum results data in magnitude vs. frequency for the current receivers.
Figure 2. Spectra Results Graphs
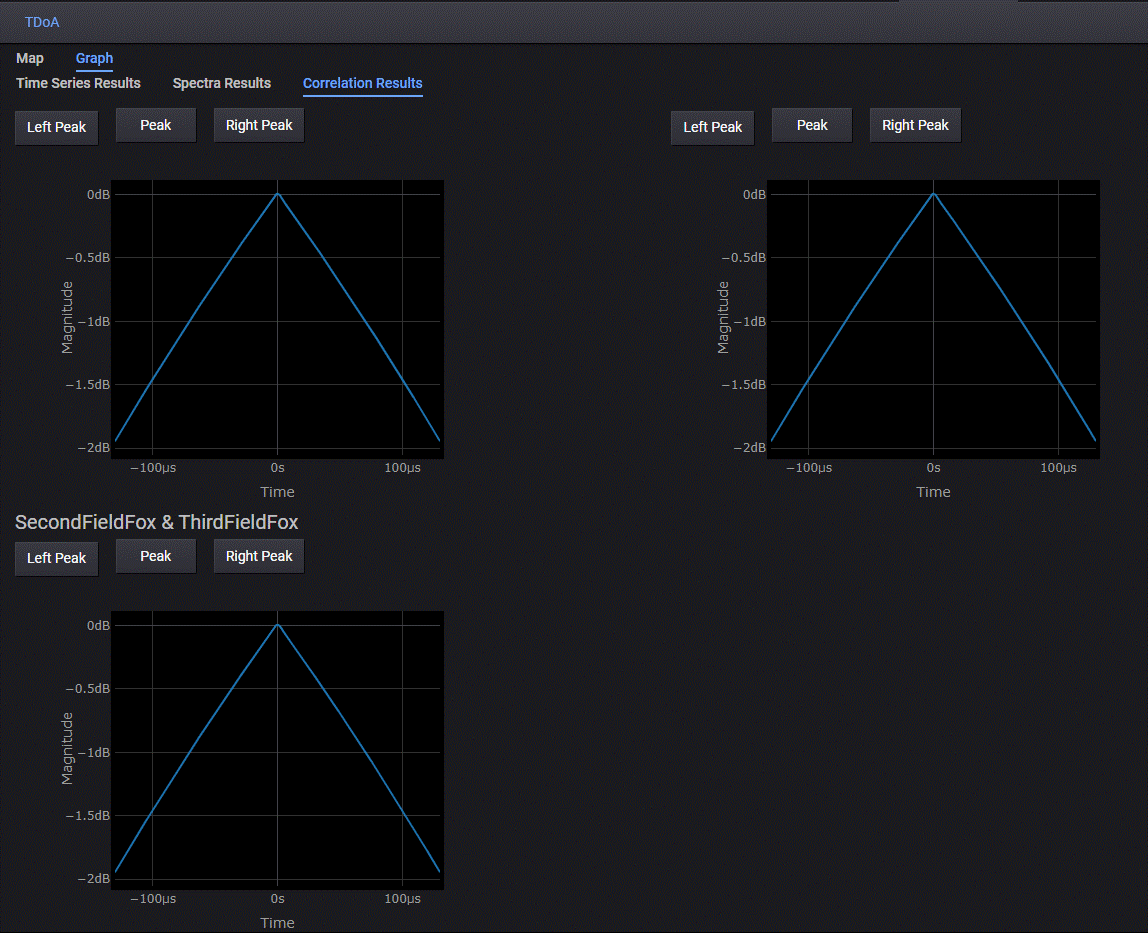
The Correlation Results displays the receivers correlated data results based on their hyperbola data.
Figure 3. Correlation Results Graphs