Waveform Histograms
A waveform histogram is a bar graph showing the number of times a vertical or horizontal value has occurred within the defined window area. (The bars in the graph are thin and appear as lines on the display.)
Two common uses for waveform histograms are measuring and characterizing noise or jitter on displayed waveforms:
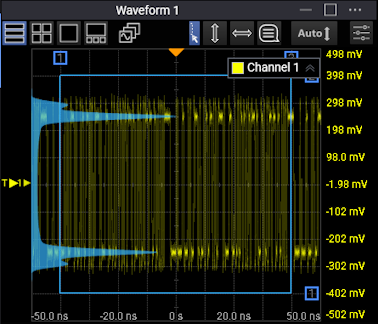
- Noise is measured by sizing the histogram window to a narrow portion of time and observing a vertical histogram that measures the noise on a flat section of a waveform.
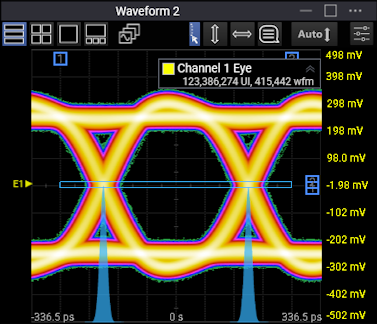
- Jitter is measured by sizing the histogram window to a narrow portion of voltage and observing a horizontal histogram that measures the jitter on an edge.
Waveform histograms can be shown for input channel waveforms, color-grade gray-scale waveforms (including real-time eyes), math function waveforms, and waveform memories.
When measuring vertical values (volts or watts, for example), the histogram window is divided into rows. Each time a waveform's vertical value is within a row, a hit is counted. The total number of hits within each row is represented by the width of its bar (line) in the graph.
Vertical Waveform Histogram
When measuring horizontal values (seconds, for example), the histogram window is divided into columns, Each time a waveform's horizontal value is within a column, a hit is counted. The total number of hits within each column is represented by the height of its bar (line) in the graph.
Horizontal Waveform Histogram
After each acquisition, the bar (line) sizes are normalized (to 1.0) and multiplied by the histogram size. This way, the bar (line) with the most hits fills the full histogram size.
As acquisitions continue, hit counters continue to accumulate. The maximum count for each counter is 232. If the histogram is left on for a very long time, the database will become saturated.
Histogram hit counter values are saved in a database. (Waveforms displayed in color grade or gray scale persistence are also hit counter databases where the hit counts at row and column intersections are displayed as an intensity. Mask testing also uses a hit counter database for counting mask violations. Histograms can be displayed by looking only at X or Y values in those same databases.)
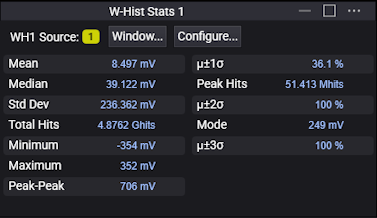
The information from a histogram can be used to perform statistical analysis on the waveform.
Resetting the Histogram Database
If something about your waveform changes, you most likely want to reset the histogram database and restart hit counting.
To reset the histogram database, press the [Clear] key located on the instrument front panel. You can also click Clear on the menu bar.
Changing the vertical scale, offset, horizontal position, horizontal scale, or trigger settings also resets the histogram database.