Waveform Histogram Results Panel
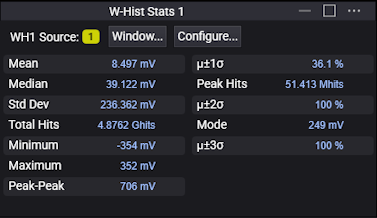
The statistical results of the histogram are displayed in the W-Hist Stats results panel. Even if the display shows only the most recent acquisitions, the histogram database keeps track of all vertical or horizontal value hits while the database is building.
| Label | Description |
|---|---|
| Mean | The average value of all the points in the histogram. |
| Std Dev | The standard deviation value of the histogram. |
| Minimum | The minimum value of the histogram. |
| Peak-Peak | The width of the histogram. For horizontal histograms, width is the time difference between the first and last pixel columns that contain data. For vertical histograms, width is the difference in volts or watts between the first and last pixel rows that contain data. |
| Peak Hits | The number of hits in the histogram's greatest peak. |
| Mode | The most common value in the histogram. In other words, the value associated with the histogram's tallest bar. |
| Median | 50% of the histogram samples are above the median and 50% are below the median. |
| Total Hits | The total number of samples included in the histogram. |
| Maximum | The maximum value of the histogram. |
| μ ± 1σ | The percentage of points that are within ±1σ of the mean value. |
| μ ± 2σ | The percentage of points that are within ±2σ of the mean value. |
| μ ± 3σ | The percentage of points that are within ±3σ of the mean value. |
For precise histogram window positioning, click Window.... See Waveform Histogram Window.
To configure the waveform histogram, click Configure... . See Waveform Histograms Dialog Box.
When more than one waveform histogram is set up, the results for each one will appear in its own results panel.