Load Offline Data Log 
While not connected to an instrument, you can load a previously-saved Data Log file and view it in the Offline Data Log Viewer (see below).
The data log files are stored with an *.ivif file extension in the "Documents" folder on your computer.
For example – C:\Users\<user_name>\Documents\Keysight\PathWaveDMM\Data Logs\.
For example – C:\Users\<user_name>\Documents\Keysight\PathWaveDMM\Data Logs\.
Offline Data Log Viewer
Below is an example of a Data Log file from the Data Logger view loaded in Offline Data Log Viewer.
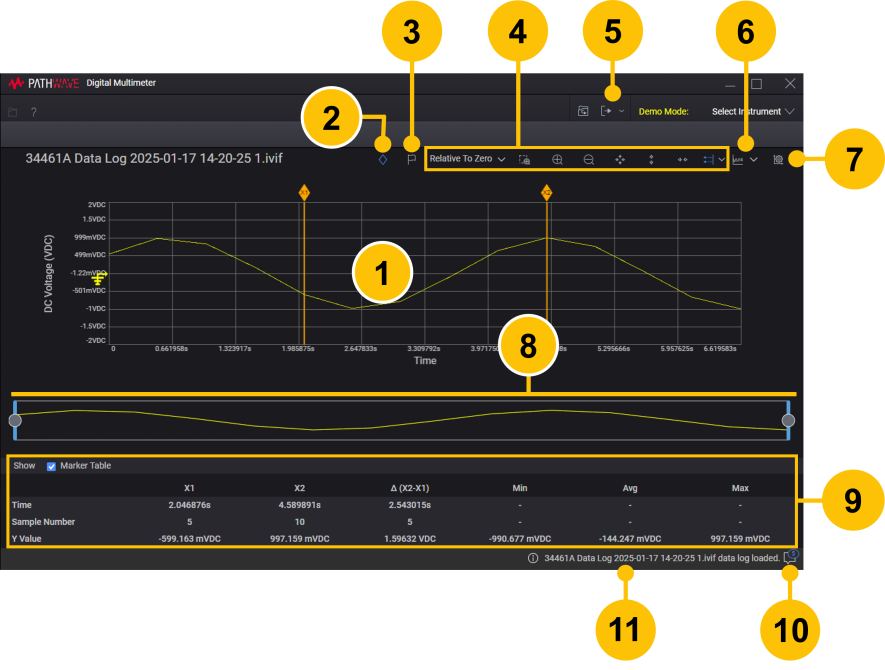
| 1 | View measurement data in line chart, histogram, or table view. Overload conditions are shown on the chart with red color (see examples). | |
| 2 | Show vertical (X1 and X2) marker pair. Click again to hide the markers. See Markers. | |
| 3 | Insert text annotation on the data point of the trace. See Annotation. | |
| 4 | Use Trace Display Toolbar to set the x-axis grid labels, zoom in/out, and auto scale the displayed data. For the grid labels, select from "Relative To Zero" (default), "Date Time" in local time, or "Date Time (UTC)" relative to Universal Time Coordinated time. | |
| 5 | Export measurement data or a screen shot of data logger chart from this application. See Export Data Log or Export Screen Shot. | |
| 6 | Show measured data in line chart, histogram, or table view. See Data Display Views. | |
| 7 | Set the trace thickness, trace color, vertical scale, vertical offset, etc. See Chart Settings. | |
| 8 | Show portion of data currently displayed on chart above. See Data Preview Bar. | |
| 9 | The Marker Table shows the trace measurement data based on relative position of each marker. See Markers. | |
| 10 | View information, warnings, and errors messages for the application. See Notifications. | |
| 11 | Information, warning, and error message for the application is shown here for a few seconds. |
During data logging and digitizing, a chart will be plotted only if the sample size is more than 1. If you open a Data Log file where a chart was not plotted, the chart area is empty.