Calibration and Measurement Tutorial (Opt.004)
After completing this tutorial, you should be familiar with the main
operating techniques and features of the N1500A Opt.004 dielectric probe
software.
Note: This tutorial uses a 91% isopropyl alcohol and 9%
water mixture as the MUT.
Set the frequency
range and type of sweep. Click Calibration
then Set Frequency. Enter
a Start frequency of 500 MHz and a Stop frequency of 2.9 GHz. The
default 51 points will cause the calibration and measurement to be
done for 51 points linearly spaced between these two frequencies.
Click OK. The main window
will now show the new start and stop frequencies.
Calibrate the system.
The calibration consists of measuring three known standards and using
the results to characterize the three major sources of measurement
error. The default calibration standards are air, a short circuit,
and water. To ensure measurement accuracy, do not move the probe
cable between calibration and measurements. If you have not already
done so, stabilize the cable by locking the probe in the mounting
bracket of the probe stand as shown in the Set
Up Probe Hardware section. Always move the sample to the probe,
never move the probe to the sample.
Click Calibration,
then Perform Cal. The following
prompts appear to instruct you to connect standards.
Leave the probe
open in air. This is the open standard. Select OK
in the dialog box and a measurement will be made.
Connect the shorting
block. The procedure for connecting the short varies with
each probe. When the short is connected, click OK.
High
Temperature Probe Short
Slim
Form Probe Short
Performance
Probe Short
Remove the short circuit and place the
probe in 25  C water.
Measure the temperature
of a vial of deionized water with a thermometer. It should be
25 ° C.
Immerse the probe in
the water by moving the water to the probe. Make sure no air bubbles
are clinging to the probe tip.
Click OK. When the
calibration is complete, remove the probe from the water and dry
it. You may want to save the calibration by selecting Save Setup
under the File menu. You are now ready
to make measurements. A measurement can be made by selecting Trigger
Measurement under the Measure menu.
Measure the MUT.
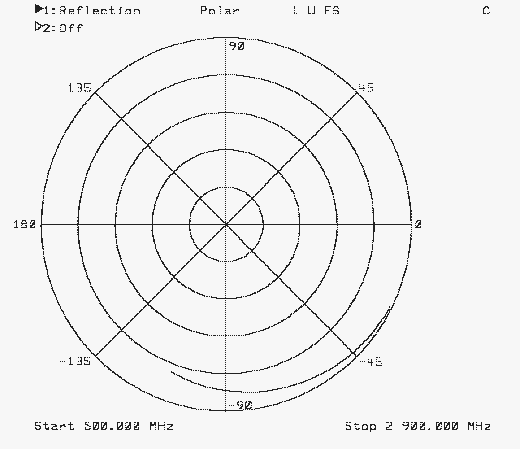
Reinsert the probe into the water you used to
calibrate the system, then click OK. The analyzer’s display should
look like the display below.
Insert the probe into the sample (MUT), then click
OK. A measurement will be triggered. The measurement should appear
on the display of the computer as shown below. This data can be
saved to a file by selecting Save Data under the File
menu.
Click Display,
then Data to Memory, then
Memory 1. A copy of the
measured water is made to this memory trace. The Chart and Table
will be updated to reflect this change.
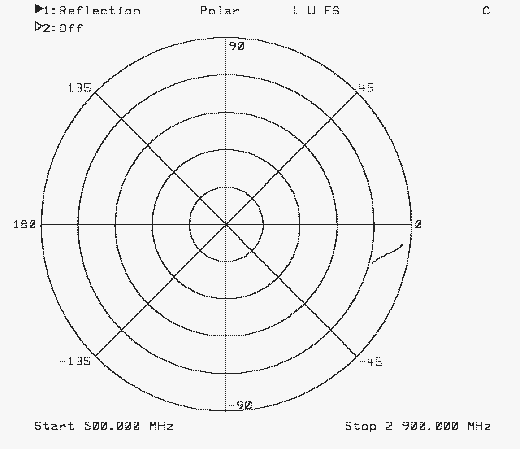
Remove the water and dry the probe. Insert the
probe into the alcohol and trigger a measurement as before. The
display on the instrument will look similar to the one shown below.
When the measurement is complete, the display on the PC should look
the one below.
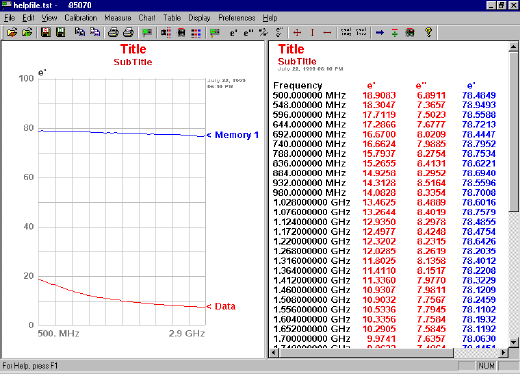
Note that only the Data trace is changed. The water measurement, stored
in Memory 1, remains unchanged.
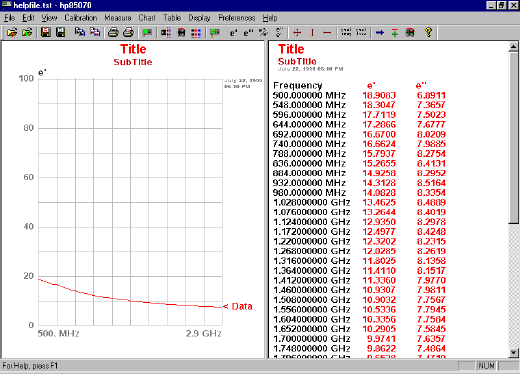
Click Display, then Traces
Displayed to select which of the four valid traces are shown in
the Chart and Table.
If you select Data then OK, the displayed window will look
like the one below.
The Chart menu allows you to select which parameter
you want to plot. Selecting  ’’ from the
Chart menu plots the measured loss factor.
Autoscale automatically selects
the scale for the displayed measurements. When this is selected, the chart
changes as shown below.
Alternatively, you can set the scale as desired using the Scale selection.
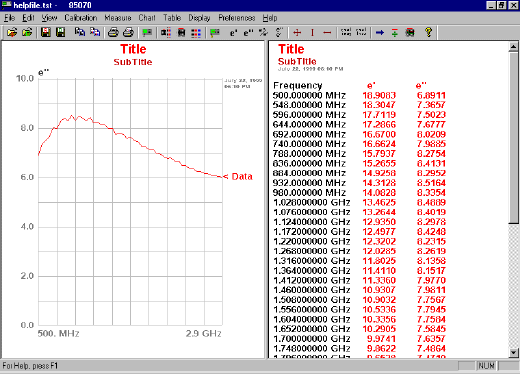
Clicking on a point of interest turns on a marker. Notice that the corresponding
point in the Table is highlighted.
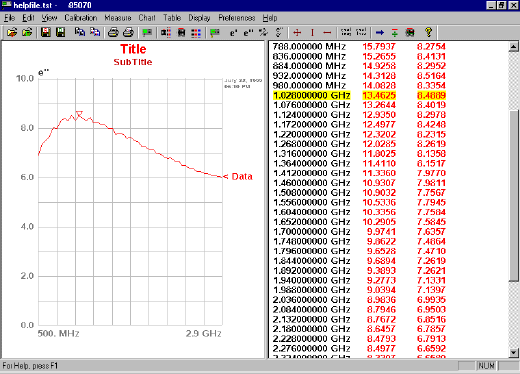
The marker can be moved by clicking at another location on the chart
or a listed value in the table. The up and down arrows on the PC keyboard
also move the marker. The marker can be turned off by clicking on the
Marker item of the Display menu.
![]() C water.
C water.


