In this topic:
Limit lines are visual representations of the specified limits for a measurement. You can use limit lines to do the following:
Provide standard criteria for meeting device specification.
Show the comparison of data versus specifications.
In PLTS, there are three ways to construct Limit Lines:
With each method, the following rules apply:
Limit lines are NOT available with Smith Chart or Polar display format.
Overlapping limit lines are allowed.
Limit testing can easily be turned OFF. Learn how.
With this method, limit lines are made up of X/Y POINTS. You can choose to connect the limit points to form a line, or leave them as discrete points.
Note: PLTS limit lines are NOT constructed the same as in the PNA.
At least TWO limit points are required to make a limit line.
You can have as many limit points as you have data points for each measurement trace.
The limits in the following image correspond to the settings in the dialog below.
On the Data Browser pane, click the Limit Mask Definition tab.
At the top of the pane, click Points
In the Line Properties section:
Click Add to create a Line.
Under Name, double-click 'Unnamed' to change the limit line name.
Under Type, select Max or Min. Any part of the measurement that falls below a Min line, or above a Max line, results in FAILED as indicated at the top of the plot.
Under Target, select the trace to which the Limits will be applied.
Repeat the above to create additional limit lines.
At the top of the pane, click Points
In the Line Properties section:
Click Import.
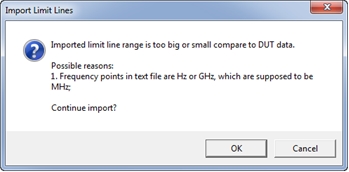
Click Browse then select the limit line file. Supported files are *.txt or *.csv file and frequencies must be in MHz.
Clikc OK.
If frequencies are not in MHz, the following error message will be displayed:
Optional
Under Color, change the color of the Limit Line.
Offset The Limit Line is offset by the specified amount each time Offset is clicked. Click a math operator symbol (+ -- * / ), then type a number (such as 5), then click Offset.
In the Points section:
Click Add. A Limit point is added BELOW the highlighted line. Note: A limit point can NOT be added before the first point. Therefore you may want to add an empty point as the first point just in case more points need to be added later.
Type an X-axis (Stimulus) value
Type a Y-axis (Response) value
Connected - defines if that line is drawn to connect to the PREVIOUS point. If yes, then the line between those points defines the limits at the measured data points.
Click Apply to update the limit lines on the display.
Continue adding points until the entire limit is constructed.
When finished, click Apply to add the line to the target plots.
Copy To Other Plots. When checked, apply the current limit lines to other plots. Click a plot to apply the limit lines.
Select the plot.
On the Line Properties list, select the line, then click Delete.
Then click Apply. The limit line is removed from the selected plot.
To continue to delete lines from other plots, check Copy to Others, then click the plots to have limits removed.
When finished removing limits, clear Copy to Others.
The following buttons apply to ALL Limit Lines:
Save Stores ALL current Limit Lines to a specified file name.
Load Deletes the Limit Lines that are currently loaded, then recalls a Limit Line file.
NOTE: Recalled Limit Lines are applied ONLY to the same parameters that they were applied to when saved.
By default, limit line PASS | FAIL testing is ON.
Click ![]() on
the Plot Toolbar
to turn ON and OFF both the limit lines and the PASS
|FAIL text.
on
the Plot Toolbar
to turn ON and OFF both the limit lines and the PASS
|FAIL text.
The PASS | FAIL text (alone) can be turned ON and OFF with a User Preference. Learn how.
PLTS interpolates the trace data points in order to test against limit lines. Therefore, it is NOT necessary to consider the X-axis location of trace data points when setting limit points.
You can use an existing trace as a basis for defining Limit Lines.
You can also use Equations as Limits to accomplish this.
In the following image, the green trace is an existing measurement. The blue trace is a MIN Limit Lime made from the same measurement, but offset by -5 dB. This Limit Line can be saved and recalled to test subsequent measurements of these DUTs.
Export a DUT measurement as a .txt, .csv, .cit and .sNp file. Learn how.
Import that trace as a Limit Line.
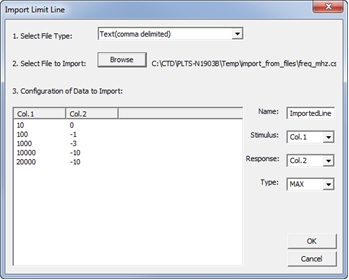
On the Limit Line dialog, click Import to launch the Import Limit Line dialog.
Note: Although PLTS can NOT import Time Domain data directly, you can import Frequency Domain data, and from that, PLTS calculates the Time domain data. This is shown in the image above. To import data for a Time Domain trace, import Frequency Domain data, then choose the Time Domain parameter for which the limit line will be used.
In the Import Limit Line dialog:
Select the file type as it was exported.
Click Browse, then find the exported file.
Under Parameter, select the parameter to receive the limit line.
For some File Types you can also select Stimulus and Response values.
Select Type: MIN or MAX (this can be changed later)
Click OK.
In the Limit Line dialog:
To Offset the Limit Line, click a math operator symbol (+ -- * / ), then type a number (such as 5), then click Offset. Each time Offset is clicked, the Limit Line is offset AGAIN by that value.
The Limit Line is displayed in Blue.
Click Save.
The following simple example shows how you can use an equation as the basis for Limit Lines. We will create two limit lines using an S21 trace as the basis. We will add a positive offset to the Max limit and a negative offset to the Min limit. The equation is used to covert the log data to linear data.
Click Tools, then Math, then Design to open Create Equations dialog.
Under Equation, enter ?:S21*pow10(3/20) where 3 is the amount of offset from the LogMag trace (S21). The '?' is used as a wildcard. Learn more.
Enter an Equation Name (like Max Offset), then click Save.
For convenience, click Pin to Equations Pane.
Do the same for a Min Offset using a negative 3 dB offset: ?:S21*pow10(-3/20)
Click Close.
Select the Limit Mask Definition pane (top) and the Parameter pane (bottom).
Select Equation on both panes.
Select the plot to receive the Max and Min Limits.
On the Parameter pane, click the pinned Equations (Min offset and Max offset)
On the Limit Mask pane, under Set as Limit Line, select Min_Limit and Max_Limit.
Click Apply to create the limits on the plot.
The plot should look similar to the following image.
If PASS is not visible on the plot, check Show PASS/FAIL Text on the User Preferences, Plot tab.