Gating provides the ability to mathematically remove the effect of a particular circuit element. You define the start and stop points of the gate. The gated section is replaced with an ideal transmission line having the same electrical delay.
Gating is applied to time plots of individual parameters. While gating the time domain plot of a parameter, you can observe the effect that gating has on the frequency domain of the same parameter.
In this topic:
Other Features to Remove Unwanted Responses
Click Utilities, then Gating.
Click either Gating (Single-Ended) or Gating (Balanced) depending on which parameter you want to gate. This selection allows you to choose from the appropriate parameters. For example, when you choose Single-Ended, the Single-Ended parameters are displayed and available for you to select from the Parameter Bar and Data menu.
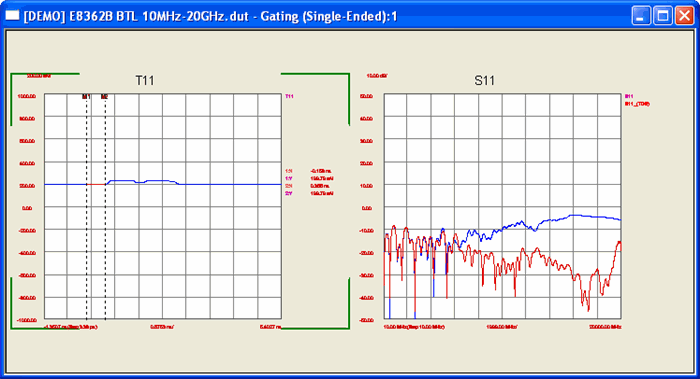
From the Parameter Bar or from the Data menu, select the parameter to which the gate setting will be applied. When you select the parameter, a new Gating Window opens with two plots displayed side-by-side as shown below:
This allows you to see how adding the gate in Time Domain affects the parameter in the Frequency Domain.
The left plot is the parameter in Time Domain.
The right plot is the same parameter in Frequency Domain.
|
The Gating dialog appears. Right-click the dialog to allow
it to float or dock. Learn
more.
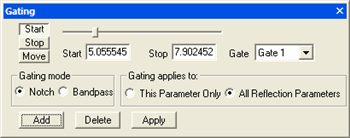
On the Gating dialog, click Start. A vertical marker (M1) line appears on the time domain plot. Using the slide control on the Gating dialog, move the line to to set the start position of the gate. The selected Start time displayed in the Start box.
Click Stop. A vertical marker (M2) line appears on the time domain plot. Using the slide control, move the line to set the stop position of the gate.
Gating Mode - Defines the type of filtering that will be performed for the gating function.
Bandpass - KEEPS the responses WITHIN the gate span; REMOVES the responses OUTSIDE the gate span.
Notch - REMOVES the responses WITHIN the gate span; KEEPS the responses OUTSIDE the gate span.
Gating applies to: (Available ONLY when a reflection parameter is selected for gating.)
This Parameter Only Select to apply the current gate settings to only the displayed parameter.
All Reflection Parameters The gate settings apply to all single-ended or differential time domain reflection parameters in the active DUT file. An error message is displayed if the Gate is too large to apply to another reflection parameter.
Note: The gate on an S22 plot appears on the opposite side as an S11 plot.
Click the Add button to add the gate. A gate identifier is added to the Gate box.
Click Apply to overwrite the displayed gate number.
In the Time Domain plot,
The RED portion of the trace is GATED OUT. and replaced with an ideal transmission line.
The BLUE portion of the trace is KEPT.
In the Frequency Domain plot
The RED trace shows how the original S-parameter looks.
The BLUE trace shows how the S-parameter looks with the gated section removed.
Repeat Steps 5 through 11 to add additional gates. A maximum of 10 gates can be added.
The gated frequency data can be exported to a text file. See Exporting Data.
Select the gate.
Click Move
Adjust the slide control left or right to the desired location.
Select Apply to gate the response.
Both the start and stop values of the gate are moved. The range between the start and stop values of the gate remains the same.
Select a gate, then click Delete.
The gate numbers are moved down in number when a gate is deleted. For example, when Gate 4 is deleted, Gate 5 becomes Gate 4, and Gate 6 becomes Gate 5, and so on. See Gate Numbering in Important Notes.
Click the X in the upper right corner of the Gating window.