The following selections from the View menu allows you to customize the PLTS screen.
Any pane can be dragged with your mouse and docked, or left to float, at a new location. That pane will be located in the new location until you move it again or click Reset (see below).
How to conveniently dock a pane:
Click on the header or tab of a pane to be moved.
Drag the pane to one of three areas on the PLTS screen.
The following navigation helper appears:
Drag the pane to the center of the helper, then release. The pane is docked in the Upper or Lower docking area.
To re-order a pane in the Upper and Lower docking areas, drag the pane across the area to its new location.
Drag the pane to one of the four outer areas of the helper. The area in which the pane will be located when released is highlighted.
To Float a pane, drag then release the pane in any area outside the helper.
Click View, then Reset Toolbars and Docking Panes to return all view items to their original state and location. PLTS must be closed and restarted.
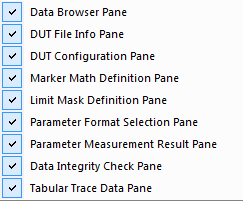
Click View, then Pane, then toggle each pane ON and OFF.
A check indicates that the associated pane is ON.
Analysis Type, Marker, Limit, and Tabular Trace Data panes are on the Data Browser Selector
DUT File, DUT View, and Trace Measure panes are on the Parameter Format Selector
Panes can be moved to float or dock on either selector. Click and drag a pane using a mouse.
Click to toggle each toolbar ON and OFF.
A check indicates that the associated toolbar is ON.
Appears when gating is enabled. Learn more.
![]()
Allows you to create and move markers. Learn more.
When a measurement has already been completed, click Measure to quickly make another measurement.
Optionally check the following to also show these dialogs:
Show Connect DUT Page - When checked, this page allows you to verify the DUT connection before the measurement.
Show
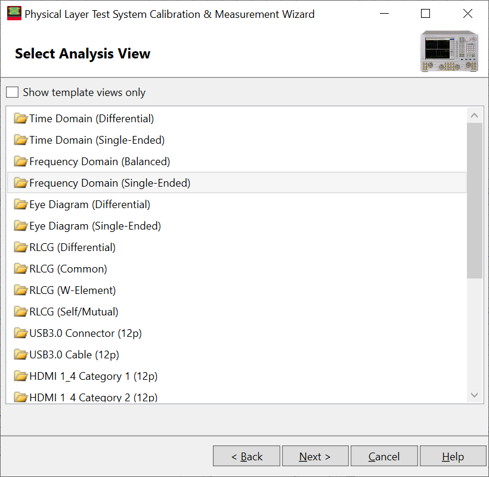
Select Analysis View Page - When checked and the Measure
button is clicked, this page is displayed allowing you to change
to a different Analysis Domain before the next measurement.
![]()
Pan (move traces within a Plot) - See Scaling.
Zoom - drag cursor to zoom on an area of the plot. Learn more.
Marker Save and Recall - Learn more.
![]()
Quickly launches the following dialogs, from left to right:
![]()
Allows you to set the horizontal and vertical scale of a plot window. Learn more.
![]()
Provides buttons for the following functions, from left to right:
New - Starts the setup wizard so that a new measurement may be made.
Open - Opens the Open dialog box so that an existing file may be opened.
Save - Opens the Save As dialog box so that a file may be saved.
Copy - Copies the active plot to the clipboard.
Export Bitmap - Saves the active plot as a .bmp file.
Remove Plot - Deletes the active plots.
Print - Prints the active plots.
About - Opens the About PLTS information.
![]()
The status bar provides a visual indication of conditions that are occurring within PLTS.
When any of the conditions listed below are active, an indicator adjacent to the condition title is displayed in a bright color. If the condition is not active, the color of the indicator is gray. The conditions are:
Measurement |
is bright when a measurement is being performed by the software. |
Continuous sweep |
is bright when the measurement is being continuously swept. |
De-Embedding |
is bright when the active plot has de-embedding data applied. |
Port Rotation |
is bright when the active plot has reference impedance applied. |
Hardware |
is bright when the hardware has been identified by the software. |
Change the look of PLTS.
The following image shows Office 2007 - Black.