The main filter measurements discussed in this topic include:

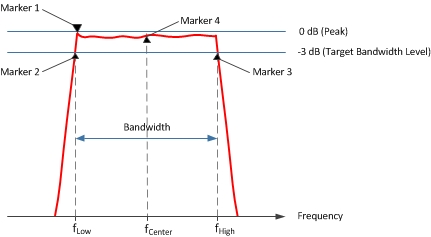
Marker search functions automatically determine the bandwidth of a band-pass filter by placing a marker on the maximum level (marker 1), a marker on the lower frequency (marker 2), and a marker on the higher frequency (marker 3). The higher and lower frequencies are determined by specifying a target bandwidth level. The default target bandwidth level is -3 dB which means that the bandwidth of a band-pass filter is determined by measuring the higher and lower frequencies at -3 dB below the peak.
To find the bandwidth of a notch filter, a positive value would be entered for the target bandwidth level (for example, 3 dB). For notch filters, the marker search functions place a marker on the minimum level (marker 1), a marker on the lower frequency (marker 2), and a marker on the higher frequency (marker 3).
In addition to being used to determine the bandwidth, markers 2 and 3 are used to determine the center frequency of a band-pass or notch filter by calculating the mathematical midpoint between them as shown in the diagram above.
After determining the bandwidth and center frequency using the marker search functions, the VNA also calculates the Q factor as the ratio of Center Frequency to Bandwidth (Center Frequency / Bandwidth).
The VNA can measure very high Q factors limited only by the IF bandwidth and the number of sampling points. You must ensure that a sufficient number of sampling points are utilized for accurate results.
The filter loss is the loss caused by the insertion of the filter into the transmission line. The loss is defined as follows:

Marker search functions retrieve the filter loss as the Y-axis value of marker 4. This is the loss of the filter at its center frequency.
The following procedure retrieves filter bandwidth, center frequency, loss, and Q factor.
Press Search > Bandwidth & Notch > BW Level.
Enter the target bandwidth level (default is -3 dB).
Note: To find the bandwidth of a notch filter, enter a positive value for the target bandwidth level.
Press Search > Bandwidth & Notch > Bandwidth Search to retrieve filter statistics.
Ripple refers to the amplitude deviation of the band-pass filter, which is also referred to as filter flatness. The VNA's trace statistics functions are used to find the peak to peak ripple in the band-pass as shown in Retrieving Peak to Peak Ripple.

The following procedure sets up and retrieves the ripple of the filter.
Press Math > Analysis > Statistics....
In the Trace Statistics dialog, select Statistics - Mean, Standard Deviation, Peak to Peak.
In the pull-down menu, select a User number to assign a range.
Enter the Start and Stop frequencies for the ripple measurement. This should be the bandwidth of the band-pass filter.
Click OK to retrieve the peak to peak ripple of the filter.
The VNA has a smoothing function that applies an average smoothing on a trace. The smoothing function is defined as follows:

where 2m + 1 is called the smoothing aperture measured in points.
The smoothing function is also provided as a percentage of the span and then converted to smoothing points as follows:

When applied, each point becomes an average of the surrounding points.
Press Avg BW > Smoothing > Smoothing ON.
If entering a percentage of the span, press Avg BW > Smoothing > Smooth Percent which will change the number of Smoothing Points appropriately.
If entering smoothing points, press Avg BW > Smoothing > Smooth Points which will change the Smoothing Percent Span appropriately.
Description |
SCPI |
COM |
| Determines the filter bandwidth -3 dB (default) below the band-pass filter peak | BandwidthTarget | |
| Searches measurement data using current Bandwidth Target to determine the bandwidth | SearchFilterBandwidth | |
| Retrieves the filter bandwidth | FilterBW | |
| Retrieves the filter center frequency | FilterCF | |
| Retrieves the filter Q factor | FilterQ | |
| Retrieves the filter loss | FilterLoss | |
| Retrieves all filter statistics | GetFilterStatistics | |
| Continually tracks the filter bandwidth | BandwidthTracking | |
|
||
| Enables/disables trace statistics | ShowStatistics | |
| Sets the start frequency for the measurement | UserRangeMin | |
| Sets the stop frequency for the measurement | UserRangeMax | |
| Sets the range used to calculate trace statistics | StatisticsRange | |
| Sets the statistic type (peak to peak) | None | |
| Retrieves the peak to peak value | PeakToPeak | |
|
||
| Turns data smoothing on/off | Smoothing | |
| Sets smoothing as a percentage of span | SmoothingAperture | |
| Sets the number of adjacent data points to average | None |