User Display is a new application class which doesn't have Hardware Control Layer. It's used to draw graph and analyze users own data on the window.
In this topic:
This feature is very useful for all users who want to draw graph on the display.
Simple Example
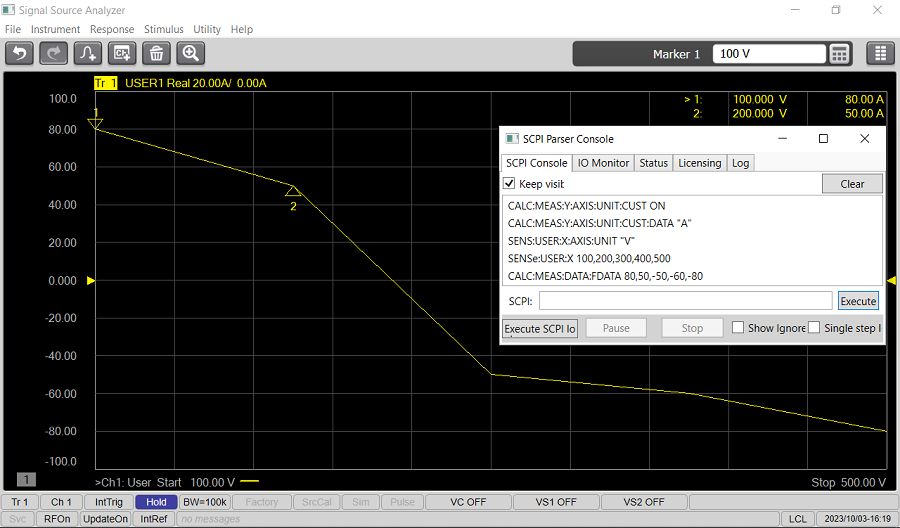
When users write macro program to process measured data with scripting language such as vbs, they can draw graph of result data which has different number of points from measured data by sending them to User Display Channel.
The following external applications are developed by using User Display.
The external application measures jitter with Phase Noise application and also measures Time vs. Frequency/Phase characteristics with Transient application of SSA.
It gets measured data from the instrument and calculates jitter trend and jitter histogram. Then it send result data back to User Display of the instrument
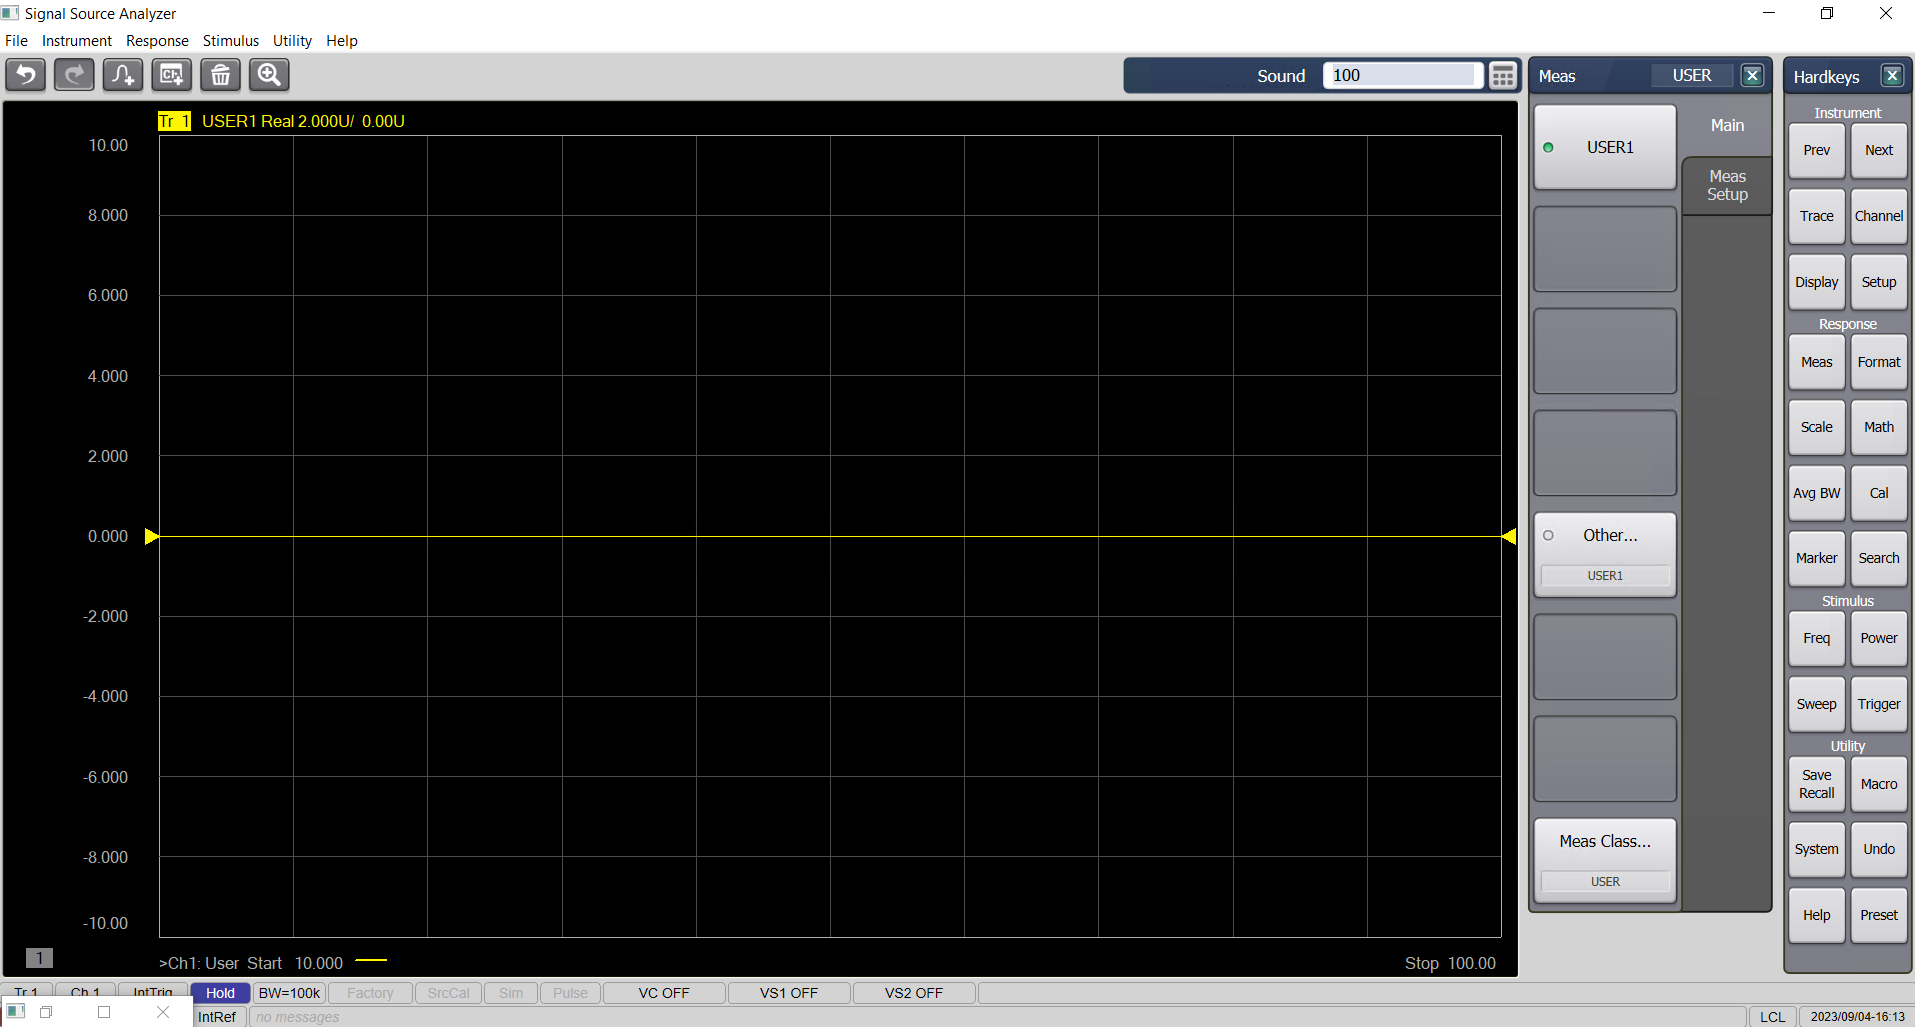
How to start User Display |
|
Using Hardkey/SoftTab/Softkey |
Using a mouse |
|
|
|
|
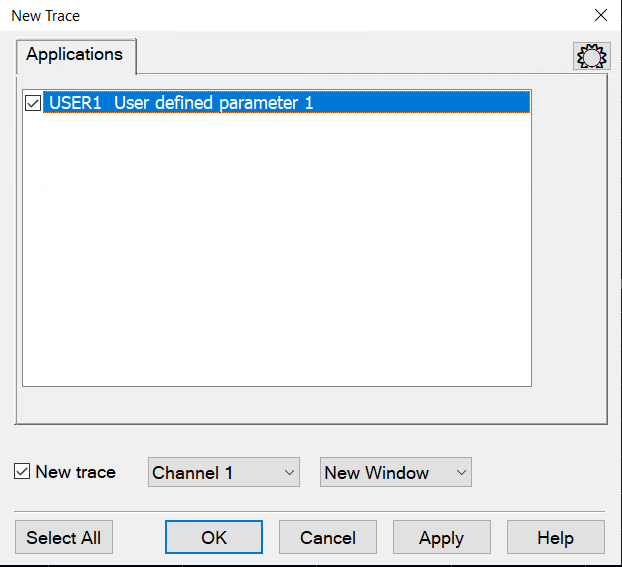
User able to add new trace under New Trace applications. Each channel has only one x-axis data which is used for all measurements of same User Display channel.
Data Input
X-Axis
Y-Axis
Axis