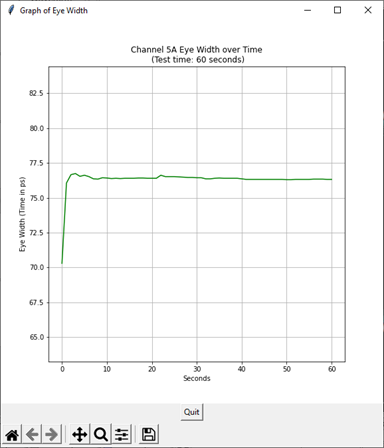
Eye measurement shown in graph (IPython console)
This Python example, Eye_measurement_graph.py, demonstates monitoring a measurement (Eye Width) over time using a simulted module. The resulting data is shown in a tkinter GUI window. If you do not wish to import matplotlib library, comment out the The draw_graph() function.
The function, monitor_eye_width(), records the data and the create_time_data() function scales the data for the correct time units: seconds, minutes, or hours.
Example Script
Copy
eye-measurement-graph.py
# -*- coding: utf-8 -*-
""" Demonstrates an Eye Width measurement that is monitored over
one minute with the Eye Width measured every second. The draw_graph()
function shows a graph of the data in a tkinter GUI window.
Installs a simulated module.
"""
from decimal import Decimal
import time
import sys
import pyvisa as visa # import VISA library
ADDRESS = 'TCPIP0::localhost::hislip0,4880::INSTR'
#ADDRESS = 'TCPIP0::K-N1000A-00003::hislip0,4880::INSTR' # DCA-X
CHANNEL = '5A'
TIME_IN_MINUTES = 1 # Monitor eye with for 1 minute
SECONDS_BETWEEN_DATA = 0.5 # Time in seconds between each measurement
def open_flexdca_connection(address):
""" Opens visa connection to FlexFlexDCA. """
print('Connecting to FlexDCA ...')
try:
rm = visa.ResourceManager()
connection = rm.open_resource(address)
connection.timeout = 20000 # Set connection timeout to 20s
connection.read_termination = '\n'
connection.write_termination = '\n'
inst_id = connection.query('*IDN?')
print('\nFlexDCA connection established to:\n' + inst_id, flush=True)
except (visa.VisaIOError, visa.InvalidSession):
print('\nVISA ERROR: Cannot open instrument address.\n', flush=True)
return None
except Exception as other:
print('\nVISA ERROR: Cannot connect to instrument:', other, flush=True)
print('\n')
return None
return connection
def all_channels_off(FlexDCA):
""" Turns all available channels off. """
for slot in '12345678':
for letter in 'ABCD':
channel = slot + letter
FlexDCA.write(':CHANnel' + channel + ':DISPlay OFF')
def install_simulated_module(FlexDCA, channel, model, signal='NRZ'):
""" Simplified installation of a simulated FlexDCA module.
model is type of simulated module. "DEM" is a dual-electrical module.
"QEM" is a quad-electrical module. "DOM" is a dual-optical
module. "QEM" is a electrical-optical module.
signal if format of signal: NRZ or PAM4.
"""
slot = channel[0]
FlexDCA.write(':EMODules:SLOT' + slot + ':SELection ' + model)
if signal in 'NRZ':
FlexDCA.write(':SOURce' + channel + ':FORMat NRZ')
else:
FlexDCA.write(':SOURce' + channel + ':FORMat PAM4')
FlexDCA.write(':SOURce' + channel + ':DRATe 9.95328E+9')
FlexDCA.write(':SOURce' + channel + ':WTYPe DATA')
FlexDCA.write(':SOURce' + channel + ':PLENgth 127')
FlexDCA.write(':SOURce' + channel + ':AMPLitude 90E-3')
FlexDCA.write(':SOURce' + channel + ':NOISe:RN 3.0E-6')
FlexDCA.write(':SOURce' + channel + ':JITTer:RJ 4.0E-12')
FlexDCA.write(':CHANnel' + channel + ':DISPlay ON')
def configure_FlexDCA(FlexDCA, channel):
""" Installs a simulated module and prepares FlexDCA for
measurements.
"""
FlexDCA.query(':SYSTem:DEFault;*OPC?')
all_channels_off(FlexDCA)
install_simulated_module(FlexDCA, channel, 'DEM')
FlexDCA.write(':CHAN' + channel + ':DISPlay ON')
FlexDCA.write(':ACQuire:RUN')
FlexDCA.write(':SYSTem:MODE EYE;*OPC?')
FlexDCA.query(':SYSTem:AUToscale;*OPC?')
def waveform_acquisition(FlexDCA):
""" Perform a pattern acquisition limit test to capture
waveform data.
"""
FlexDCA.query(':SYSTEM:AUToscale;*OPC?')
FlexDCA.write(':ACQuire:STOP') # single acquisition mode
FlexDCA.write(':ACQuire:CDISplay') # Clear display
FlexDCA.write(':LTESt:ACQuire:CTYPe:WAVeforms 10')
FlexDCA.write(':LTESt:ACQuire:STATe ON')
FlexDCA.query(':ACQuire:RUN;*OPC?')
FlexDCA.write(':LTESt:ACQuire:STATe OFF')
FlexDCA.query(':ACQuire:RUN;*OPC?')
def monitor_eye_width(FlexDCA, channel, minutes, seconds):
""" Monitors the temperature for required minutes by performing a
measurement every seconds. channel is a string, minutes (float) and
seconds (int).
"""
print('Monitoring Eye Width. Time required: {} seconds.'.format(minutes * 60))
print('Please wait...')
data_length = int((minutes * 60) / seconds) + 1 # number of data points
data = [0 for x in range(data_length)]
FlexDCA.write(':MEASure:EYE:LIST:CLEar')
FlexDCA.write(':MEASure:EYE:EWIDth:SOURce CHAN' + channel)
FlexDCA.write(':MEASure:EYE:EWIDth')
data_pt = 0
while data_pt < data_length:
reading = float(FlexDCA.query(':MEASure:EYE:EWIDth?'))
width = Decimal(reading / 1E-12)
data[data_pt] = width.quantize(Decimal('0.01'))
data_pt += 1
time.sleep(seconds)
if data_pt % 50:
print(' .', end='')
else:
print('\n')
print('\n')
return data
def create_time_data(number_of_data_points, minutes, time_sep):
"""
Creates list of time data and scales it for seconds, minutes, or hours
units. The units (xunits) is returned. The argument, number_of_data_points,
is an int. The minutes argument is the total test time (float). The
time_sep argument is the seconds (int) between data points.
"""
xunits = ''
time_data = [] # list of times for each data point
if 0 < minutes < 5: # 5 minutes
time_data = [(i*time_sep) for i in range(0, number_of_data_points)]
xunits = 'seconds'
elif 5 <= minutes < 180: # 5 to 180 minutes (3 hours)
time_data = [(i * time_sep / 60) for i in range(0,
number_of_data_points)]
xunits = 'minutes'
else: # >= 3 hours
time_data = [(i * time_sep / 3600) for i in range(0,
number_of_data_points)]
xunits = 'hours'
return time_data, xunits
def draw_graph(y_data, x_data, xunits, channel):
"""
A matplotlib graph is created and saved to a file in the default folder.
y_data argument is a list of Decimals of Eye Width readings.
x_data argument is corresponding time positions.
xunits is 'seconds', 'minutes', or 'hours'.
channel argument is a string. eg, '1A'.
"""
import tkinter
from matplotlib.backends.backend_tkagg import (FigureCanvasTkAgg, NavigationToolbar2Tk)
from matplotlib.figure import Figure
print('Drawing graph.', flush=True)
root = tkinter.Tk()
root.wm_title("Graph of Eye Width")
fig = Figure(figsize=(8.0, 8.0), dpi=96, edgecolor='black') # width and height in inches
ax = fig.add_subplot(111)
ax.grid(b=True, which='major', axis='both')
ax.set_xlabel(xunits.capitalize())
ax.set_ylabel('Eye Width (Time in ps)')
s = 'Channel ' + channel + ' Eye Width over Time'
s += '\n (Test time: ' + str(round(x_data[-1], 1)) + ' ' + xunits + ')'
fig.suptitle(s, y=0.85, fontsize=12)
if len(y_data) < 20:
ax.plot(x_data, y_data, 'g.-') # data points shown
else:
ax.plot(x_data, y_data, 'g-') # data points hidden. line only
canvas = FigureCanvasTkAgg(fig, master=root)
canvas.draw()
toolbar = NavigationToolbar2Tk(canvas, root)
toolbar.update()
button = tkinter.Button(master=root, text="Quit", command=root.quit)
button.pack(side=tkinter.BOTTOM)
toolbar.pack(side=tkinter.BOTTOM, fill=tkinter.X)
canvas.get_tk_widget().pack(side=tkinter.TOP, fill=tkinter.BOTH, expand=1)
print('Graph of returned data is displayed in a separate window on PC.')
sys.stdout.flush() # Flush print message in stdout
tkinter.mainloop()
FlexDCA = open_flexdca_connection(ADDRESS)
configure_FlexDCA(FlexDCA, CHANNEL)
waveform_acquisition(FlexDCA)
y_data = monitor_eye_width(FlexDCA, CHANNEL,
TIME_IN_MINUTES, SECONDS_BETWEEN_DATA)
pts = len(y_data) # data points in channel. 1st row of matirx
x_data, xunits = create_time_data(pts,
TIME_IN_MINUTES,
SECONDS_BETWEEN_DATA)
draw_graph(y_data, x_data, xunits, CHANNEL)
FlexDCA.write(':SYSTem:GTLocal')
FlexDCA.close()