Graphing a remote head's temperature over time
This Python example, remote_head_temperature_graph.py, graphs the temperature of a remote head over time. Supported remote head modules are the N1045A electrical and N1055A TDR module. A graph is saved as a graphics file (PNG) and as a postscript file (PS, vector):
- remote_head_temperatures.png
- remote_head_temperatures.ps
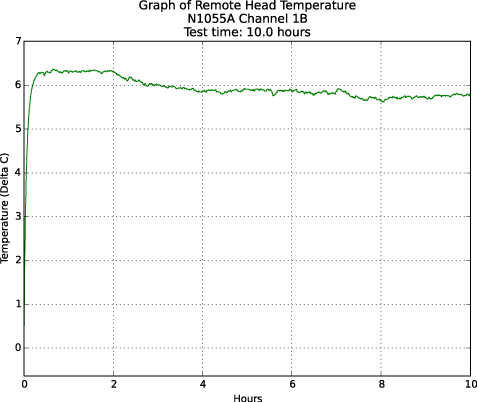
The postscript file is editable in Adobe Illustrator as it is a vector file. The following picture shows the temperature variation of a remote head in a thermally uncontrolled setting. A reading was taken every 5 seconds for 10 hours.
This graph is a result of the module being inserted into an N1000A just before the test was started. Obviously, with a change of 6V at the start of the test one would want to perform a quick module calibration.
Example Script
Copy
remote-head-temperature-graph.py
# -*- coding: utf-8 -*-
""" Requires:
- an N1045A electrical or N1055A TDR module.
- Must enter channel number in script's CHANNEL constant.
Graphs the temperature of a remote head over time. This script:
- Confirms that required modules are installed.
- Discovers available channel. Prompts for module to monitor.
- Reports temperature changes in remote head in remote_head_temperatures.png in scripts folder.'
"""
from decimal import Decimal
import matplotlib.pyplot as plt
import math
import sys
import time
import pyvisa as visa # import VISA library
ADDRESS = 'TCPIP0::K-N1000A-QA06::hislip0,4880::INSTR' # DCA-X
CHANNEL = '1A'
def open_flexdca_connection(address):
""" Opens visa connection to FlexFlexDCA. """
print('Connecting to Flexdca ...')
try:
rm = visa.ResourceManager()
connection = rm.open_resource(address)
connection.timeout = 20000 # Set connection timeout to 20s
connection.read_termination = '\n'
connection.write_termination = '\n'
inst_id = connection.query('*IDN?')
print('\nFlexDCA connection established to:\n' + inst_id, flush=True)
except (visa.VisaIOError, visa.InvalidSession):
print('\nVISA ERROR: Cannot open instrument address.\n', flush=True)
return None
except Exception as other:
print('\nVISA ERROR: Cannot connect to instrument:', other, flush=True)
print('\n')
return None
return connection
def get_test_parameters():
""" Return how long a test takes and how many seconds between measurements.
"""
minutes = get_total_test_time()
if not minutes:
return '', 0, 0 # abort program
seconds = get_time_between_measurements()
return minutes, seconds
def get_total_test_time():
""" Asks user for total test time in minutes. """
while(True):
minutes = input('How many minutes must test run? ')
minutes = minutes.strip('"\' ')
try:
if minutes == 'q':
return 0
minutes = float(minutes)
return minutes
except ValueError:
return 0
def get_time_between_measurements():
"""
Asks user for time between each measurement in seconds. The
float conversion tests for a valid number string and if
not throws an exception. Conversion fails if not a proper number string.
"""
while(True):
seconds = input('How many seconds between each measurement? ')
seconds = seconds.strip('"\' ')
try:
if seconds == 'q':
return 0
return float(seconds)
except ValueError:
return 0
def monitor_temperature(channel, minutes, seconds):
""" Monitors the temperature for required minutes by performing a
measurement every seconds. channel is a string, minutes (float) and
seconds (int).
"""
global FlexDCA
DEGREE = '\u00B0' # °
DELTAU = '\u0394' # Δ
print('Measuring remote head\'s temperature. Please wait.\n')
sys.stdout.flush()
thermal_data = [] # list of Decimals
start_temp = Decimal(FlexDCA.query(':CAL:CHAN'+channel+':STAT:DTEM?'))
start = time.time()
first_pass = True
elapsed_time = 0
i = 1 # measurement count
while elapsed_time < (minutes * 60):
current_temp = Decimal(FlexDCA.query(':CAL:CHAN' +
channel +
':STAT:DTEM?'))
change = current_temp - start_temp
thermal_data.append(change.quantize(Decimal('0.01')))
s = str(thermal_data[-1])
results = s + DEGREE + 'C'
if s[0] == '-':
print(str(i) + '. ' + DELTAU + ' = ' + results, flush=True)
else:
print(str(i) + '. ' + DELTAU + ' = ' + results, flush=True)
i += 1
elapsed_time = time.time() - start
if elapsed_time > 60.0 and first_pass:
first_pass = False
if math.fabs(thermal_data[-1]) > 0.5:
print('\nThe remote head\'s temperature has \
changed more than\n 0.5C-per-minute. \
A module calibration is recommended.\n')
sys.stdout.flush()
time.sleep(seconds)
print(str(len(thermal_data)) + ' temperature readings were taken.')
sys.stdout.flush()
return thermal_data
def create_time_data(number_of_data_points, minutes, time_sep):
"""
Creates list of time data and scales it for seconds, minutes, or hours
units. The units (xunits) is returned.
number_of_data_points argument is an int.
minutes argument is the test time (float).
time_sep argument is the seconds (int) between data points.
"""
xunits = ''
time_data = [] # list of times for each data point
if 0 < minutes < 5: # 5 minutes
time_data = [(i*time_sep) for i in range(0, number_of_data_points)]
xunits = 'seconds'
elif 5 <= minutes < 180: # 5 to 180 minutes (3 hours)
time_data = [(i*time_sep / 60) for i in range(0,
number_of_data_points)]
xunits = 'minutes'
else: # >= 3 hours
time_data = [(i*time_sep / 3600) for i in range(0,
number_of_data_points)]
xunits = 'hours'
return time_data, xunits
def plot_thermal_data(y_data, x_data, xunits, channel):
"""
y_data argument is a list of Decimals of temperature readings.
x_data argument is corresponding time positions.
xunits is 'seconds', 'minutes', or 'hours'.
channel argument is a string. eg, '1A'.
"""
global FlexDCA
max_y = float(max(y_data))
min_y = float(min(y_data))
if min_y == 0.0 and max_y == 0.0:
max_y = 1.0
min_y = -1.0
else:
yrange = max_y - min_y
yspace = yrange * 0.1
max_y = max_y + yspace
min_y = min_y - yspace
model = FlexDCA.query('SYST:MODel? SLOT' + channel[0])
title = 'Graph of Remote Head Temperature\n'
title = title + model + ' Channel '+channel+'\n'
title = title + 'Test time: '+str(round(x_data[-1], 1))+' ' + xunits
plt.figure(figsize=(8, 6), dpi=80)
plt.ylim(min_y, max_y)
plt.grid(b=True, which='major', axis='both')
plt.title(title)
plt.xlabel(xunits.capitalize())
plt.ylabel('Temperature (Delta C)')
if len(y_data) < 20:
plt.plot(x_data, y_data, 'g.-') # data points shown
else:
plt.plot(x_data, y_data, 'g-') # data points hidden. line only
plt.savefig('remote_head_temperatures.png', dpi=300)
plt.savefig('remote_head_temperatures.ps', dpi=300)
print('The file "remote_head_temperatures.png" has been saved.')
print('The file "remote_head_temperatures.ps" has been saved.')
FlexDCA = open_flexdca_connection(ADDRESS)
test_time, time_sep = get_test_parameters()
if test_time and time_sep:
print('Capturing channel ' + CHANNEL + ' data.')
y_data = monitor_temperature(CHANNEL, test_time, time_sep)
x_data, xunits = create_time_data(len(y_data), test_time, time_sep)
plot_thermal_data(y_data, x_data, xunits, CHANNEL)
print('Program has successfully completed.')
else:
print('Error. Test time not correct.')
FlexDCA.write(':SYSTem:GTLocal')
FlexDCA.close()