Histograms
A histogram is a probability distribution derived from the waveform database (input channels, waveform memory, color-grade gray-scale memory, and math functions). The measurement database consists of all data samples displayed on the display. Every time a display sample point is acquired on a display coordinate, the counter for that coordinate is incremented. As the total count increases, the range of hits also increases. The maximum count for each counter is 232. If the histogram is left on for a very long time, the database will become saturated. The measurement database is active in the color grade persistence display mode (or gray scale persistence) and during the performance of mask tests.
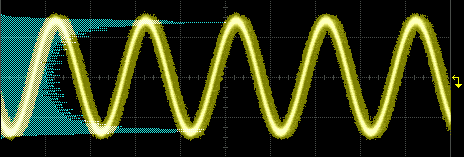
The information in a histogram is used to perform statistical analysis on the waveform. You can define and display the histogram either vertically for voltage and power measurements or horizontally for timing measurements. The histogram is displayed as a series of horizontal or vertical lines each having a width of one display pixel. The source waveform may still be viewed through the histogram lines.
Histograms can be constructed in Oscilloscope, Eye/Mask, and TDR/TDT instrument modes.
A Vertical Histogram

To avoid erroneous data, reset the measurement database. To reset the measurement database, press the Clear button located on the instrument front panel. You can also click Clear on the menu bar. Changing the vertical scale, offset, horizontal position, horizontal scale, and trigger settings also resets the measurement database.
If mask testing or the color grade persistence display mode (or gray scale persistence) is enabled, the measurement database has already begun construction. The histogram is then derived from that database. The measurement database continues to build until the instrument stops acquiring data or the histogram, mask test, color grade/gray scale persistence features are turned off.