Jitter Mode
Jitter mode measurements can be made on NRZ (Non-Return to Zero) and PAM4 coded signals (optical or electrical). Measurements can not be performed on data using PAM6, PAM8, or RZ coding. Depending on the waveform's format (NRZ or PAM4), Jitter mode scalar measurement results are displayed either on the:
- Jitter and Amplitude panels (NRZ) , or
- Eye and Level panels (PAM4).
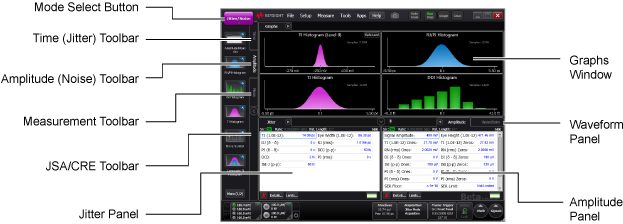
The Jitter and Amplitude panels are identified in the following picture. Each panel includes a default set of scalar measurements. You can add additional measurements by selecting them on the Meas toolbar. The toolbar also includes a Reset button for each results panel. The toolbar also includes buttons that view a Phase-Only Jitter panel or 12-Edge Output Jitter panel.
To view the underlying eye diagram, from which all jitter measurements are derived, view the Waveform panel. The following picture shows FlexDCA using the default Tungsten theme.
In Jitter Mode, Jitter Spectrum Analysis and SW Clock Recovery Emulation (JSA) can be used to provide greater insights concerning jitter and improves measurement accuracy.
Jitter mode requires the Research and Development package license.
The following features are not available In Jitter Mode: Markers, Waveform memory, Color Grade-Gray Scale Memory, Mask Tests, Histograms, and Horizontal skew adjust. Changing instrument modes does not reset any jitter configuration settings.
Selecting Jitter Mode immediately starts the measurement process with an Auto Scale which performs the following:
- Automatically detects the trigger pattern and establishes pattern lock.
- Scales the eye diagram.
- Performs all Jitter component measurements.
- Displays results in a panel as well as graphs.
Triggering
Jitter Mode requires an internally-generated pattern trigger that automatically detects symbol rate, pattern length, and trigger divide ratio. In most cases, you don't need to know or enter these values. The trigger bandwidth settings in the Trigger dialog are not enabled or used in Jitter Mode.
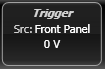 Click the Trigger button to view the Pattern Lock Setup page on the Trigger Setup dialog. This page is used for modifying important triggering parameters such as symbol rate, clock rate, and pattern length.
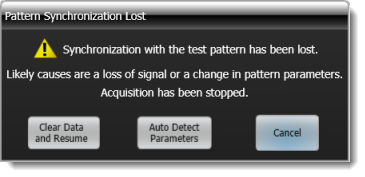
If the signal changes for whatever reason, the pattern trigger may become unlocked and the Pattern Synchronization Lost dialog displayed. If this happens, confirm the following conditions still apply:
- Signal and synchronized trigger clock are still being applied to the N1000A.
- Signal's symbol rate, pattern length, and trigger divide ratio have not changed
- When using a clock recovery module, check that this dialog is not hiding the Clock Recovery Lock Lost dialog. Check that the clock recovery module is locked on the signal. Restore lock and then troubleshoot the loss of pattern lock.
After restoring the clock and data, click Clear Data and Resume to perform an Auto Scale. Click Auto Detect Parameters to perform an Auto Scale and additionally detect the symbol rate, pattern length, and trigger divide ratio. Click Cancel to remove the dialog without initiating any action and with all data acquisition stopped. For more information, refer to Pattern Lock Setup tab (Trigger dialog) and Jitter Measurements tab (Configure Measurements dialog).
Auto Scale
Whenever Jitter Mode is entered, the instrument performs an Auto Scale, which detects clock rate, pattern length, and trigger divide ratio. These automatically detected values can be individually turned off and the values manually entered. When you press the front-panel Auto Scale key, the following functions are automatically performed:
- Detects signal type: clock or data
- Detects clock rate, pattern length, and trigger divide ratio
- Generates internal pattern trigger
- Clears existing Jitter measurement data
- Creates edge models and acquires data
- Displays and scales representative eye diagram showing sampling area
- Jitter graphs and results displayed
Clear Display
Click Clear on the menu bar whenever jitter conditions change during testing. This is because all Jitter Mode results and graphs are based on accumulated data (histograms). Pressing Clear Display clears all previously acquired data and ensures that the results and graphs reflect current signal conditions. You may also need to press Auto Scale. Jitter edge models are not remodeled.
Waveforms
 By default in Jitter Mode, the underlying eye diagram, from which all jitter measurements are derived, is displayed in Waveform panel. This panel is displayed in the lower-right corner of the display as shown here. This eye diagram is always active (as well as all histograms), being updated with every acquisition cycle. When annotations are turned on, the Edge Samples region is annotated on the eye diagram showing where data is being actively sampled as explained in Jitter Measurement Algorithm. You can also temporarily switch to Eye/Mask Mode in order to view the individual symbol trajectories in the data pattern and an averaged eye diagram.
Channels, Math Functions, and Jitter Data Memory
In Jitter Mode, you can measure one live channel or math function at a time. This data can be saved to Jitter Data Memory. If any channels are on when Jitter Mode is entered, the lowest numbered channel is measured, while all other channels and math functions are turned off. If all channels are off but one or more math functions are on, the lowest number math function that is on is measured. Once in Jitter Mode, turning on another channel or math function makes the newly activated signal the source for the jitter measurements and turns off the previous source.
Measurement Panel's SP Notice
The SP (Signal Processed Waveform) notice appears in the upper-right corner of results panels. This notice is a reminder that the jitter measurement was performed on a waveform on which FlexDCA's signal processing has been applied.

Measurement Panel's LJM Notice
The LJM (Large Jitter Mode) notice appears in the upper-right corner of results panels. This notice appears if the combined Random Jitter (RJ) and Periodic Jitter (PJδ-δ) exceeds the rise time or fall transition time of the signal. The instrument automatically recognizes this condition and accurately measures the jitter.

If the message "Unable to Characterize Edges: Eye is closed" appears, the Jitter has exceeded the measurable range for this signal. You must select one of the following choices:
- Retard the edge speeds using, for example, a low-pass filter. Note that this may add data dependent jitter (DDJ) due to inter-symbol interference (ISI).
- If the jitter is being intentionally induced on the signal, reduce the RJ and PJ.
- Switch to Oscilloscope Mode and perform a conventional Oscilloscope Jitter measurement. Or, switch to Eye Mode and perform a conventional Eye Mode Jitter measurement.
Measurements on Devices using a Modulated Clock
When making measurements on devices that use a modulated clock, reduce the trigger's Minimum Timebase Position to 24.1 ns to ensure that lock can be established. Click Setup > Trigger, and select the Advanced Trigger Setup tab. Reduce the setting to its minimum value (24.1 ns). Spread spectrum clocks that are used in computers are an example of a modulated clock. Jitter measurements on devices with a modulated clock can result in artificially higher measured jitter levels, due to the N1000A's trigger delay. Reducing the Minimum Timebase Position reduces the amount of observed jitter.