Histogram Configuration
Use the Histograms dialog to turn on and configure up to four histograms. Select Histograms On to turn on the selected histogram. The histogram default state is off. You can also open this dialog by clicking the Configure button on the Histogram results table.
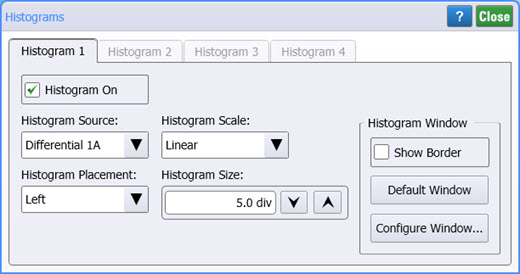
The default setup positions the histogram markers as follows:· X1 < X2· Y1 < Y2. The values of X1 and Y1 can be made greater than the values of X2 and Y2 by repositioning the markers. The histogram window is always the area inside the boundaries of X1 and X2 and Y1 and Y2, regardless of the marker values.
Histogram Source
Since histograms are derived from the instrument's measurement database, the histogram values correspond to a row or column in the database. The database that is used to construct the histogram is dependent upon the selected source (channel, memory, or math function). The instrument converts the row and column numbers to time (seconds) and amplitude (volts or watts) values using the scaling values of the selected the database source. Therefore, the histogram results from each source will vary depending on the scaling of the source. For example, if the vertical scale of the selected source is set to 50 μW/div, and Y1 position is set to 100 mW and Y2 position is set to 0 μW, the distance between the histogram markers is two divisions apart. The default source is the first channel, memory, or math function turned on.
Histogram Placement, Scale, and Size
Selects the orientation of the histogram. Select Left or Right for voltage or power measurements. Select Top or Bottom for timing measurements.
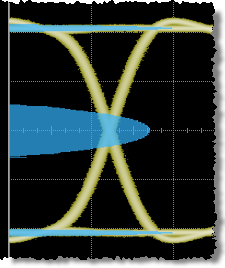
Left-Aligned Vertical Histogram
Bottom-Aligned Horizontal Histogram
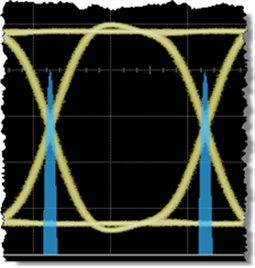
Histograms are displayed as a series of lines (vertical or horizontal). The length of each line represents the frequency or number of hits of data on that row (or column) of the display. Zero hits correspond to the left edge (when Left placement is selected) of the graticule (vertical histogram), or the bottom edge (when Bottom placement is selected) of the graticule (horizontal histograms). The histogram display size is normalized each time that the histogram is displayed. The largest sum of all the rows (or columns) is used to normalize the other sums. The normalized sums are multiplied by the value defined in the Histogram Size box and plotted using horizontal (or vertical) lines. Therefore, the line representing the maximum number of data hits acquired in the histogram is always the same length regardless of the maximum number of hits. The range of values for vertical histograms is 1 to 8 divisions; the default value is 4 divisions. The range of values for horizontal histograms is 1 to 10 divisions; the default value is 5 divisions. In each case the default places the maximum number of hits at the half the graticule size.
FlexDCA maintains separate size settings for the vertical and horizontal axes. Therefore, when you switch between a vertical histogram and a horizontal histogram, you must redefine the size setting.
Histogram Window
Click the Default Window to set the histogram window to the default position.
 Click Show Border to view histogram window markers and a solid-line histogram window border that shows the location of the histogram window. The border allows you to view which region of the instrument's measurement database is used to construct the histogram. Click Default Window for the default window. Or, click Configure Window to create a custom window region. By default, the border is off. The histogram must be enabled prior to enabling the histogram window border. The histogram window border remains displayed until you turn histograms off, clear Show Borders, or perform a default setup. The measurement database is common to the color grade/gray scale persistence display mode and performance of mask tests.
Default Histogram with Left Placement