Histogram Results Panel
Instrument
N1000A
N109x
UXR Scope
Flex Apps:
FlexDCA
FlexRT
The statistical results of the histogram are displayed on the Histogram table located on the display. Even if the display shows only the most recent acquisitions, the measurement database keeps track of all display coordinates hit while the measurement database is building. Histogram measurements can be made on several sources at the same time. Click Window to configure the histogram window area. Click Configure to configure the histogram. Notice that when more than one histogram is displayed, you can click the arrow buttons at the top of the results table to select which histogram results are displayed.
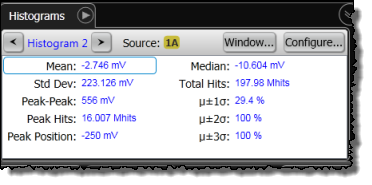
| Label | Description |
|---|---|
| Mean | The average value of all the points in the histogram. |
| Std Dev | The standard deviation value of the histogram. |
| Peak-Peak | The width of the histogram. For horizontal histograms, width is the time difference between the first and last pixel columns that contain data. For vertical histograms, width is the difference in volts or watts between the first and last pixel rows that contain data. |
| Peak Hits | The number of hits in the histogram's greatest peak. |
| Peak Position | The position of the maximum peak of the histogram. |
| Median | 50% of the histogram samples are above the median and 50% are below the median. |
| Total Hits | The total number of samples included in the histogram. |
| μ ± 1σ | The percentage of points that are within ±1σ of the mean value. |
| μ ± 2σ | The percentage of points that are within ±2σ of the mean value. |
| μ ± 3σ | The percentage of points that are within ±3σ of the mean value. |