Histogram Window
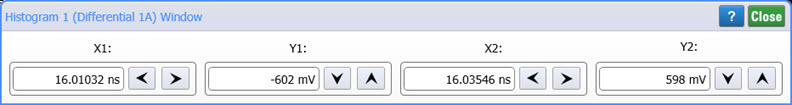
Use the Histogram Window dialog to define the region of the database that is used to construct the histogram. Only this region of the database will be used to calculate the histogram results. Exact values for each of the four histogram window edges can be entered in this dialog.
Two common uses for histograms are measuring and characterizing noise or jitter on displayed waveforms. Noise is measured by sizing the histogram window to a narrow portion of time and observing a vertical histogram that measures the noise on a flat section of a waveform. Jitter is measured by sizing the histogram window to a narrow portion of voltage and observing a horizontal histogram that measures the jitter on an edge.
The histogram window markers are only displayed when Show Border is selected in the Histograms dialog.
The value limits of the markers and the position arrows are dependent upon the vertical and horizontal scale settings. Use the keypad to define the histogram window boundaries beyond the vertical and horizontal limits of the display graticule. This will place the actual boundaries of the window off the screen. Placing the histogram markers beyond the graticule area results in a histogram of only the graticule area. However, if you turn a marker knob or click the position arrows, the value of the window boundary will snap to the value of the edge of the display graticule.