Opening an Eye Diagram
Opening an Eye Diagram
This example demonstrates how signal processing can be used to open an eye diagram. It uses a simulated Extended Module to create a simulated signal. You can use a real data signal if you prefer. The procedure uses a simulated 9.95328 GBd PRBS data signal.
Configuring a Simulated Signal with a Closed Eye
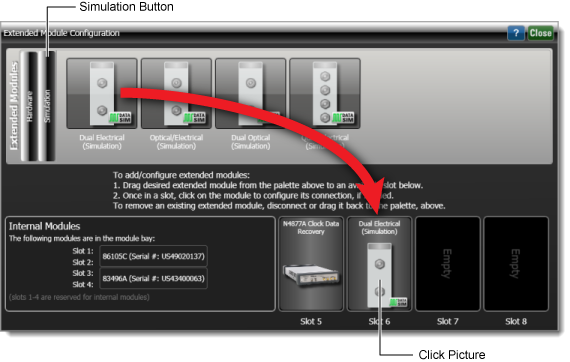
- Click Setup > Configure Extended Modules.
- Click the Simulation button and drag a simulation module down into one of the slots at the bottom of the dialog.
- Click on the picture of the simulated module.
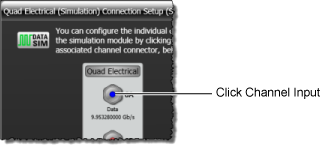
- In the picture, click on a channel input connector. This opens the Configure Simulated Source dialog.
- In the dialog, click on the data source field to define a 9.95328 GBd PRBS 7-1 (127 symbols) signal. In the Filter field, select 4th order Butterworth. Enter a Cutoff Freq of 3 GHz, which is approximately one third of the symbol rate.
- Close the dialogs.
Turn on Eye/Mask Mode with Pattern Lock
- Click Auto Scale in the menu bar. Or, use the keyboard shortcut Ctrl-Alt A.
- Place FlexDCA in Eye/Mask Mode.
- Lock the trigger to the data stream's pattern by clicking the pattern lock icon which is located at FlexDCA's bottom button bar. The icon changes to show it is locked.

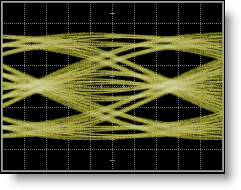
- The displayed signal should have a closed eye diagram. In the remaining steps, we'll use signal processing to open this severely closed eye.
![]()
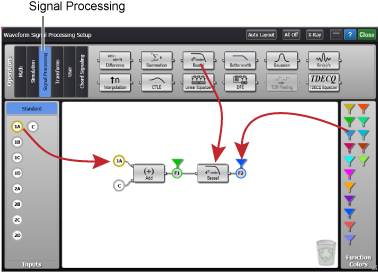
Apply Signal Processing
- Click Measure > Waveform Signal Processing.
- In the Waveform Signal Processing tool's Operators Pane, click the Signal Processing button.
- Drag the Linear Equalizer operator onto the construction area.
- Drag a function color icon over the output of the Linear Equalizer operator as shown in this figure. If not already placed, drag the channel 1A icon to the input of the operator. In this example, the function color icon determines the color of the displayed output waveform, will be green.
- In the signal processing diagram, click on the Linear Equalizer operator to open the Equalizer Setup dialog.
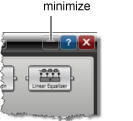
- Minimize the Waveform Signal Processing dialog so that only the FlexDCA's main display and the Equalizer Setup dialog are visible. This will allow you to view changes to the eye diagram as you change the linear equalizer's settings.
- In the Equalizer Setup dialog, click on the expander arrow to show the advanced settings.

- In the dialog, confirm that Automatic Taps is selected.
- Experiment changing the Number of Taps, Precursors, and Taps/Bit fields to see how they affect the eye diagram.
-
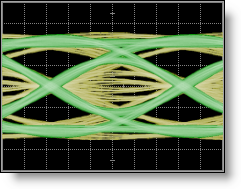 The following settings produced the opened eye diagram shown in this figure. The input waveform is yellow and the output waveform is green.
 - Number of Taps: 6
- Precursors: 1
- Taps/Bit: 2
- Auto (Tap Track Spacing): off
- Bandwidth: 4 GHz