Waveform Signal Processing
Introduction
Waveform signal processing provides a variety of operators that you can use to build up to 64 powerful functions for modifying channel or memory waveforms. The output of your functions can be displayed on the screen just like any other waveform. You can also perform measurements, apply histograms, use markers, and perform mask tests on these waveforms.
To open this dialog, click Measure > Waveform Signal Processing.
Quick Starts
- Opening an Eye
- De-Embedding
- Chord Signaling operators
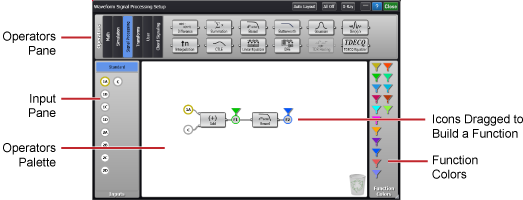
To construct your function, simply drag operators and inputs to the operators palette area as explained later in this topic. To view the output waveform, drag a function color to your function's output. The following table shows the types of inputs that are available in the Input Pane.
Features of the Waveform Signal Processing Tool
| Icon | Description |
|---|---|
|
|
Drag a channel icon to an operator's input. A gray icon color shows that the waveform is not displayed. Once placed, click on the icon to open the Channel Setup dialog from which you can turn the display of the channel waveform on, adjust the channel's scale and offset, and change the waveform's color. |
|
|
Drag a differential channel icon to an operator's input. A gray icon color shows that the waveform is not displayed. Once placed, click on the icon to open the Channel Setup dialog from which you can turn the display of the channel waveform on, adjust the channel's scale and offset, and change the waveform's color. |
|
|
Drag a memory icon to an operator's input. A gray icon color shows that the waveform is not displayed. Once placed, click on the memory icon to open the Memory dialog from which you can define the memory and turn the display of its waveform on or off. The icon's color will match the color of the memory waveform. |
|
|
 Drag this constant icon to the inputs of Add and Subtract Math operators and to the Versus Transforms operator. Once placed, click on the icon to define the constant's value. Numeric constants have the same vertical scale as the associated waveform source. The constant icon is always a gray color as you can not assign a waveform to it. Drag this constant icon to the inputs of Add and Subtract Math operators and to the Versus Transforms operator. Once placed, click on the icon to define the constant's value. Numeric constants have the same vertical scale as the associated waveform source. The constant icon is always a gray color as you can not assign a waveform to it. |
Each operator that you place is assigned an output funtion. By default this function is not displayed as shown by the icon's gray color. To display a function waveform, drag a Function Color icon to it. The following table describes the application of function colors to function outputs.
| Icon | Description |
|---|---|
|
|
Shows the color of the associated waveform. Assign a function color to an output waveform by dragging this icon from the function color panel. |
|
|
A gray icon indicates a function whose waveform is not displayed. Click on the icon to open the Function Setup dialog from which you can turn the display of its waveform on or off and assign waveform colors. Using this dialog, you can also scale the waveform. |
|
|
A function whose waveform is diplayed. The icon's color indicates the color of the displayed waveform. Click on the circle portion of the icon to open the Function Setup dialog from which you can turn the display of its waveform on or off and assign waveform colors. Using this dialog, you can also scale the waveform. |
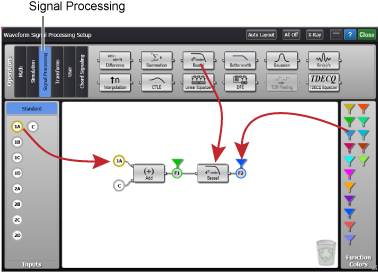
To create a function
- Locate an operator from the Operator categories that are shown at the top of the application. You can use operators from different Operator categories in the same function setup.
- Drag one or more operators into the window's operators palette.
- To remove a operator, drag it to the recycle bin icon or drag it back to the operators pane.
-
 Drag input icons from the input panel to the inputs on your function diagram. Default operator inputs are automatically placed but can be changed.
 - Drag appropriate function color icons (
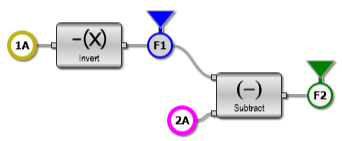
 ) to the outputs on your functions. The icon color determines the color of the simulated waveform. In this example, the waveforms have the following colors. If you drag the output color icon to the recycle bin, the associated waveform is not displayed.
 - Channel 1A's waveform is yellow
- Channel 2A's waveform is pink
- Function 1's waveform is blue
- Function 2's waveform is green
- If the operator has a note icon (
 ,
,  ), click on the operator to open a dialog which you can use to define the operator. The icon indicates a suggestion on using the operator. The icon indicates that important information is missing from the operator setup. Click on the operator to complete the configuration. Hover the cursor over the icon to see a short description of the note.
 -
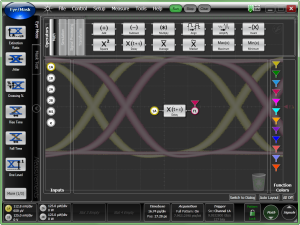
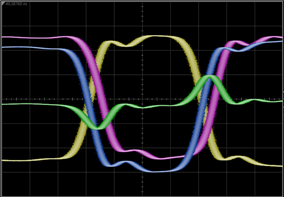 Minimize the waveform signal processing tool, so that you can view the displayed waveforms. In this example, the waveform for Channel 1A is yellow, channel 2A is pink, function 1 is blue, and function 2 is green.

You can duplicate an existing operator by Ctrl-clicking on the operator and then dragging the operator to a new position.
An offset has been applied to the above example waveforms so that you can more clearly see the individual waveforms.
 Notice in this example, that two channel inputs and two output simulated waveforms are displayed. Each waveform is identified by offset markers that are shown along the display's right side. You can turn off the display of the channels. To turn off the display of a function, in the waveform signal processing tool drag the appropriate output function color to the displayed recycle bin icon.
You can copy an operator within the signal processing construction area. By holding the control key while dragging, you can duplicate an operator including its configuration.
Click All Off to delete all created Waveform Signal Processing functions from the Waveform Signal Processing Setup dialog's Operators palette. In addition, any defined function output waveforms are turned off. This removes all waveform signal processing.
Source Rules
- If the source waveforms have different record lengths, the function is performed over the shorter record length. The instrument finds the nearest point in the longer waveform record that corresponds to the current point in the shorter record. It then performs math functions on those points and skips non-corresponding points in the longer record.
- If the two sources have the same time scale, the resulting function has the same time scale which results in the same time base scale for the function. If the sources cover two different time intervals, the function is performed on the portion of the sources that overlap. If the sources don't overlap, the function cannot be performed.
- If the two sources have different horizontal scale settings (possibly when using a waveform memory as a source) the resulting function has the same horizontal scale as source 1.
Quick Access to Math Palette
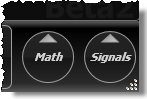 You can quickly access the Math palette by clicking on the Math button that is located in the bottom-right corner of the application. With this method, the window is semi-transparent which allows you to view the effects of the function immediately on the displayed waveforms.