Cumulative History (Spectrogram / Color Map)
combines multiple traces into a single view, using color to show how often a pixel was crossed by a trace line, expressed as a percentage of the number of measurement sweeps since the last measurement restart.
This 3D trace mapping provides an excellent way of noticing transients, since once the transient happens, it will continue to be shown on the trace. For example, the following Cumulative History trace shows a transient error in the spectrum of the signal (indicated by the green arrow superimposed on the trace screenshot). The Map Color Scheme chosen is , which makes transient events more noticeable by mapping them to a bright red instead of a dark blue as in the color map.
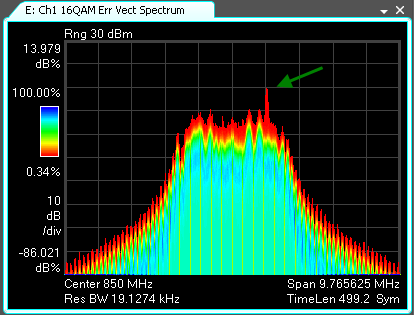
The color bar on the left shows the currently selected Map Color Scheme. Above and below the color bar are the maximum and minumum density values in the trace, which are mapped to the top and bottom colors in the color bar, respectively. Density values between the maximum and minimum values are linearly mapped to the current color bar. You can change the appearance of the color bar using the Enhance and Threshold parameters.
For a 3D Trace Mapping to function properly, the time stamp for the underlying data must change each each scan (trace update). For more information, see About 3D Trace Mapping.
Unlike Spectrograms, Cumulative History does not have a trace buffer but rather stores a single value for each pixel in the trace. When you zoom in on a specific area on the trace, instead of seeing more detail, the pixels in the selected area will be enlarged to fit the new X and Y-axis scaling. To view Cumulative History for the zoomed region, restart the measurement, which will clear the Cumulative History data and start performing the Cumulative History measurement on the new zoomed region.
To ensure that your 3D mapping trace only shows data from the current measurement setup parameters, restart the measurement after changing measurement setup parameters.
Marker values
If you place a marker on the cumulative history trace, you will see that the units are in percent (%). The value for each pixel indicates the number times that the trace line crosses the pixel divided by the number of measurement sweeps.
For trace formats where the trace line can only cross each pixel once, a value of 100% for a pixel indicates that the trace line crossed that pixel on each measurement sweep. The following table categorizes the trace formats according to how many times the trace line can cross a pixel on a measurement sweep.
|
Only once |
More than once |
|---|---|
There are a couple other things to be aware of when using markers on a Cumulative History trace:
- The percentage values for the pixels above a single X-axis position do not necessarily sum to 100%. Trace lines with steep transitions may cross more than one pixel for the same X-axis position which means that the sum of all the percentages along a vertical line at that X-axis position will be more than 100%.
- Normal and delta markers are placed on the trace line from the last measurement sweep. To view the density for other positions on the trace, use a Fixed marker.
See Also