Enhance (Spectrogram / 3D Map)
The value set for determines how colors are distributed in the color bar for 3D map displays. The default value is 50% (even distribution of colors in the Map Color Scheme to the color bar).
The enhancement value can be changed by clicking the color bar in a spectrogram or cumulative history trace and roll the mouse wheel. Other options are to double-click the color bar to bring up the dialog box and set the percentage or adjust the enhancement value from the Spectrogram / 3D Map Toolbar.
Changing the enhancement can improve the appearance of some 3D map traces. Also changing the enhancement may be able to highlight obscure signals.
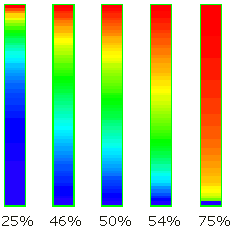
The parameter is specified as a percentage in the range 0% to 100%. The percentage specified is used to redistribute the colors in the color bar, as shown in the following illustration. (for this example, 64 colors are used)

Notice from the previous illustration that a percentage of 50% evenly (linearly) distributes the colors in the color bar. A percentage less than 50 exponentially compresses the colors into the top of the color bar, whereas a percentage greater than 50% exponentially compresses the colors into the bottom of the color bar.
See Also
