About Spectrograms (Spectrogram / Color Map)
Spectrograms use the Y-axis for time (one trace/measurement sweep per line). The amplitude, which would have been shown on the Y-axis, is represented by color. The X-axis of the spectrogram still represents the X-axis of the underlying trace data.
Spectrogram is not useful when using signal tracking since the VSA moves the center frequency to track the signal causing the frequency locations of the horizontal traces to different.
A spectrogram flows from the bottom to the top of the display. The most recent trace is the trace at the bottom of the display, the previous trace is the 2nd row from the bottom of the display, and so forth.
The number of sweeps required to fill the display depends on the size of the trace grid area and whether Fixed Height is selected. To maximize the number of trace lines shown, maximize the window containing the spectrogram and set the Trace Layout to .
Spectrogram data for traces that contain Z-axis data comes from the 2D average line which averages all the z-axis values for each x-axis point.
See About Spectrogram Markers for information about using markers with spectrograms.
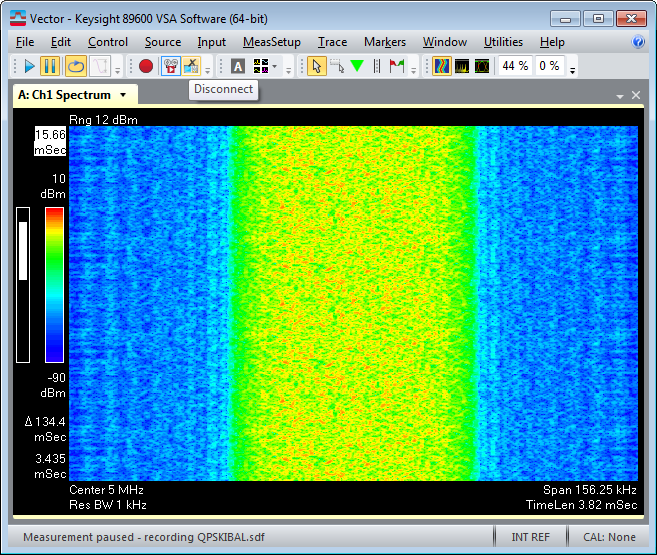
The following display shows a spectrogram in trace A. For this example, the spectrogram displays approximately 200 traces.
For a 3D Trace Mapping to function properly, the time stamp for the underlying data must change each each scan (trace update). For more information, see About 3D Trace Mapping.
To ensure that your 3D mapping trace only shows data from the current measurement setup parameters, restart the measurement after changing measurement setup parameters.
To configure spectrogram parameters, see the following topics:
Colors in a Spectrogram
With spectrogram displays, colors indicate vertical displacement. Different colors represent different y-axis values. The color bar at the left side of the display indicates the color scheme used.
The VSA shows the range of Y-axis values that the color bar represents above and below the color bar. The top color in the color bar represents Y Top; the bottom color represents Y Bottom.
Supported trace formats
The spectrogram display does not allow these trace formats:
- I-Q and Constellation
- Eye Diagrams
- Trellis Diagrams
If the spectrogram is enabled for these trace formats, the VSA stores the information in the trace buffer but shows only the latest trace. The measurement can be paused and the Trace Select marker used to see previous traces in another trace window. Or a trace format can be selected that allows the spectrogram display.
Saving and recalling spectrograms
Use Save Trace and Recall Trace to save and recall traces with spectrograms. saves whatever is shown in the active trace. When a spectrogram is recalled, it is put in a data register.
When a trace is saved with Spectrogram enabled, the data in the spectrogram trace buffer is saved as well.
See Also