Error Vector Spectrum (Low | Mid | High Band) (MB-OFDM)
The Low | Mid | High Band trace shows the error vector spectrum of the corresponding Low | Mid | High Band. (For example, the Low Band Error Vector Spectrum trace shows data from the Low Band.) If the trace reports DATA? instead of data, or other problems, see Trace Problems.
This trace is organized with the Error Vector Magnitude (EVM Error vector magnitude (EVM): A quality metric in digital communication systems. See the EVM metric in the Error Summary Table topic in each demodulator for more information on how EVM is calculated for that modulation format.) on the y-axis and OFDM Orthogonal Frequency Division Multiplexing: OFDM employs multiple overlapping radio frequency carriers, each operating at a carefully chosen frequency that is Orthogonal to the others, to produce a transmission scheme that supports higher bit rates due to parallel channel operation. OFDM is an alternative tranmission scheme to DSSS and FHSS. subcarriers -61 to +61 on the x-axis (appears as Start and Stop on the trace). Each vertical subcarrier line displays a quantity of Low, Mid, or High Band symbol-times (depending on which band, Low, Mid or High, is being measured), where the number of symbol-times corresponds to the settings for Result Length, Measurement Offset, and Measurement Interval (appears as TimeLen on the trace). The EVM measurement for each subcarrier displays the error vector magnitude between the measured (IQ Meas) vector and an ideal (IQ Ref) vector. The companion RMS Error Vector Spectrum trace displays the average error vector magnitude of all the EVMs at a particular subcarrier for all symbol-times within the burst, while the Comp Error Vector Spectrum displays a composite trace of all Low, High, and Mid Bands. Also see Trace > Data > Composite traces that show all bands. For trace identification, the pilot and guard symbols are colored differently than the data symbols.
Setup Example
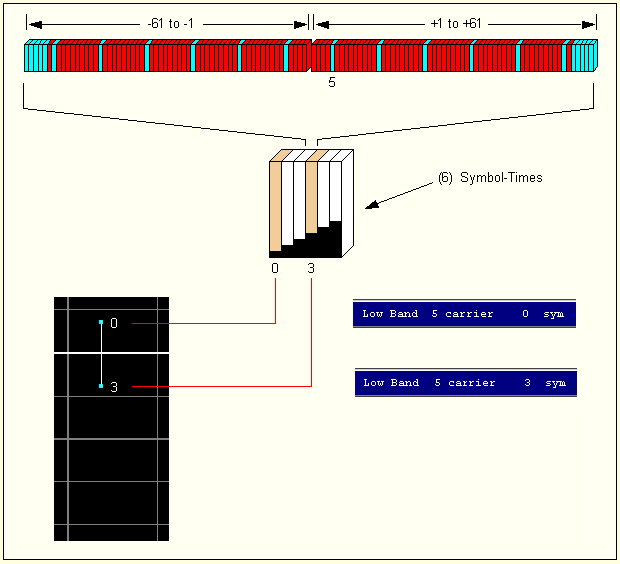
Select the . Let Result Length = 12 | Measurement Offset = 0 | Measurement Interval = 6 | TFC = 1. With these parameters, the first (6) hop symbol-times 0 to 5 are being measured, in sequence Low-Mid-High-Low-Mid-High (see below). Each of the (6) symbol-times is a burst of OFDM symbols -61 to -1 and +1 to +61. For this example, look at the EVMs for pilot subcarrier = 5, Low Band, where each subcarrier displays (2) OFDM symbols, 0 and 3 for Low Band (1 and 4 for Mid Band and 2 and 5 for High Band). Using the Select Area tool and Markers = Show Marker, expand the trace for subcarrier 5 and note the EVM calculations. The illustration below shows an example for the Low Band (symbols 0 and 3).
See Also
Error Vector Spectrum (Composite) (MB-OFDM)
Available Trace Data (MB-OFDM)