10RTSA (Real-time Spectrum Analyzer) Mode—Option 350
RTSA Mode measures signals at the SA RF IN connector.
For a comprehensive RTSA mode tutorial, see Understanding and Applying Probability of Intercept in Real-time Spectrum Analysis (App Note) at https://www.keysight.com/us/en/assets/7018-04381/application-notes/5991-4317.pdf.
Figure 10-1 RTSA Display using Markers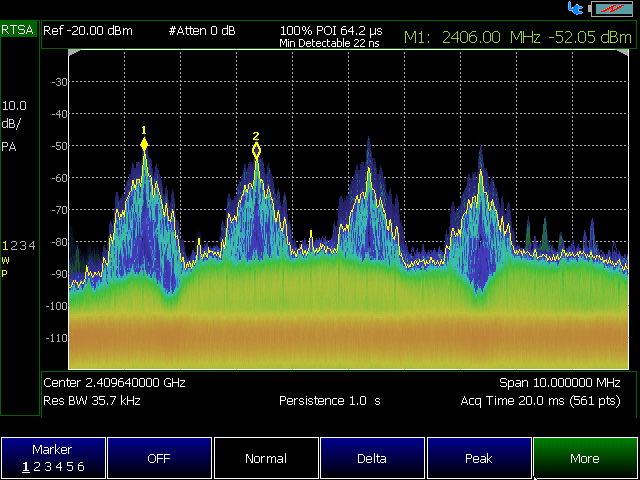
The graphic above shows an RTSA display of a Bluetooth signal using markers.
Figure 10-2
The graphic above shows an RTSA display shows an RTSA display of an 80 MHz linear FM chirp with a center frequency of 1 GHz (requires Option B10).
In this Chapter:
See Also
Select RTSA Mode before making any setting in this chapter.
Because there is no calibration, these settings can be made in any order.
How to select RTSA Mode
—Press Mode_
—Then Real-Time SA.
| When you initially select I/Q Analyzer, Real-time SA, or some of the other spectrum settings (such as center frequency) a factory channel Equalization measurement is applied to the signal. During channel equalization measurement, the FieldFox displays a “Start Channel Equalization”. Stopping channel equalization is not permitted. See also, “Alignments” on page 219, in Chapter 9, “SA (Spectrum Analyzer) Mode (Option 233–Mixed Analyzers).” |

The X-axis frequency range determines the frequencies that are measured for each sweep. The default Start frequency is 950 MHz. However, the Start frequency can be set as low as –150 MHz. The internal LO of the FieldFox can be seen at 0 Hz, which will mask signals that may be present.
| Although the start frequency can be set as low as -150 MHz, amplitude accuracy is specified above 9 kHz (depending on your model). Below 9 kHz (depending on model), frequency accuracy is maintained, but amplitude accuracy is degraded. Refer to https://www.keysight.com/us/en/assets/3126-1012/data-sheets/FieldFox-D-Series-Handheld-Analyzers.pdf. The FieldFox can be used with both VDI and OML frequency extender. Refer to “Utilities” on page 862, the Configuration Guide at: https://www.keysight.com/us/en/assets/3125-1447/configuration-guides/FieldFox-Handheld-Analyzers-D-models.pdf, and to “Contacting Keysight” on page 5. |
The frequency range of the measurement can be changed using the following methods:
—Set Center and Span frequencies (Frequency Span varies with instrument model)
—Set Start and Stop frequencies
—Toggle between Zero and Last selected span
—Using Marker -> Center
—Press Freq/Dist.
—Then choose from the following:
—Center and Freq Span frequencies. This is the most common method of entering frequency range. Enter the frequency of interest. The Center frequency is at the exact center of the X-axis. The Frequency Span places half of the frequency range on either side of center. When the Center and Frequency Span values are entered, then the X-axis annotation on the screen shows the Center and Span frequencies.
—Start and Stop frequencies. Start is the beginning of the X-axis and Stop is the end of the X-axis. When the Start and Stop frequencies are entered, then the X-axis annotation on the screen shows the Start and Stop frequencies.
—Optionally, press More then:
——CF Step then type a step size value using the numeric keypad, then select a multiplier key.
——Freq Annotation and one of the following:
AutoSelect (Default) – The FieldFox selects a frequency annotation setting (CenterSpan or StartStop). |
CenterSpan -The center frequency and span are displayed. |
StartStop - The start and stop frequencies of the frequency span are displayed. |
——Full Span the frequency span changes the instrument’s full frequency span (frequency span is model dependent). When in full span, ADC dither raises the noise floor at the edges of the 120 MHz.
—Follow each of these, when prompted, by entering a value using the numeric keypad, the  arrows, or the rotary knob.
—When using the arrows, press Enter. The increment setting of the arrows is based on the current span. This can be changed in RTSA Mode.
—After using the keypad, select a multiplier key. Learn more in “Multiplier Abbreviations” on page 53.
Adjust the Y-axis scale to see the relevant portions of the data trace.
The Y-axis is divided into 10 graticules. A acquisition is shown on the screen as a solid horizontal bar that can be placed at any graticule.
RTSA always uses logarithmic scale. The Y-axis reference line represents the specified absolute acquisition (dBm). Y-axis graticules show dB below or above the reference line.
When RF Attenuation set to Auto, the RF Attenuation is coupled to acquisition.
How to set Scale
Press Scale / Amptd. Then choose from the following:
Manually set Scale, acquisition, and Reference Position.
—ScaleEnter a value using the numeric keypad, the Manually adjust the dB scale per division to view specific areas of the current trace. arrows, or the rotary knob. Then press Enter.
—Ref Level Manually set the value of the reference line. Enter a negative value by pressing Run/Hold (+/-) either before or after typing a value. This can also change the RF Attenuation setting. See “Attenuation Control” on page 280.
—Ref Pos Manually set the position of the reference line. Values must be between 0 (top line) and 10 (bottom line). Default position is zero (top).
When using an external amplifier or attenuator, the RTSA mode trace amplitude values can be offset to compensate for the effect of the external device. This effectively moves the reference plane of the RTSA measurement port out to just beyond the external device. For example, when using an external preamp with gain of +10 dB, enter this value for External Gain, and the data trace across the displayed frequency span will be adjusted down by 10 dB.
When RF Atten is set to Auto, you may see a change in the RF Attenuation value. This is an attempt to measure the signal at top of screen (the acquisition) without overloading the RTSA first mixer.
How to Set External Gain
—Press Scale/Amptd.
—Then External Gain
—Enter a value using the numeric keypad, the arrows, or the rotary knob (positive for gain; negative for loss). Values in increments less than 5 dB must be typed using the numeric keypad. Then press Enter
ExtGain xx dB is shown at the top of the screen.
Both the RF Attenuation and Preamp functions control the power level into the RTSA.
When too much power is present at the RF Input port, ADC Over Range appears on the FieldFox screen. This does not necessarily mean that damage has occurred, but that the measurement is probably compressed.
When high power levels are present at the RF Input port, internal attenuation can be switched in to keep the FieldFox receiver from compressing. At extremely high power levels, use external attenuation to protect the internal circuitry from being damaged.
| Learn more about ADC over range warnings by referring to Chapter 31, “System Settings,” and then to “SA” on page 882. |
The displayed power level is automatically adjusted for RF Attenuation. As the attenuation value changes, the displayed power level should NOT change.
—Press Scale/Amptd.
—Then RF Atten Man Auto
—Auto RF Attenuation is set by adjusting the acquisition. As the acquisition is lowered, for example from –10 dBm to –40 dBm, the FieldFox assumes that you are looking at low-level signals. The RF Attenuation value is automatically lowered in 5 dB steps to allow low-level signals to be viewed.
—Man RF Attenuation is set manually. Enter a value between 0 to 40 dB in 5 dB steps using the numeric keypad, the arrows, or the rotary knob. Then press Enter.
#Atten xx dB is shown at the top of the screen. (#) means manual setting.
Preamplifier Control (Opt 235)
When very low-level signals are analyzed, an internal preamplifier can be used to boost the signal level by approximately 15 to 20 dB (depending on model). The gain of the preamp is NOT adjustable. The displayed signal level is automatically adjusted for the increase in system gain, therefore turning the Preamp ON should NOT cause a change to the displayed signal.
By default, the preamp is OFF.
—Press Scale/Amptd.
—Preamp ON OFF When ON, PA is shown to the left of the graticules on the display.
—Auto When Auto is selected, the preamp setting is coupled to the RF attenuation and to the acquisition. When the acquisition reaches a certain value, the preamp is turned on and PA is shown to the left of the graticules on the display.
Check for Compressed Measurements
Compression occurs when too much power into an amplifier causes it to no longer amplify in a linear manner. When too much power goes into the FieldFox RF Input connector, the amplifiers in the RTSA receiver compress and signal power will not be displayed accurately. This can occur even if ADC Over Range is not displayed because devices other than the ADC, such as the mixer, might be compressed. Increase the RF Attenuation value to prevent the RTSA receiver from being compressed.
How to Check for a Compressed Measurement
—Using a marker at the signal peak, make note of the signal power level.
—Increase the RF Attenuation level by 5 dB.
—If the signal level does NOT change, then NO compression exists. This indicates that the signal is in the linear region of the FieldFox receiver.
—If the signal level DOES increase, then the receiver was compressed. Set the RF Attenuation value at the setting when further increases no longer result in an increase in the displayed power level.
To select the spectrum-type for your measurement:
How to make Spectrum Settings
—Press Measure 1
—Then Press:
—Density Spectrum The signal displayed is a real-time spectrum with a histogram bitmap. Refer to Figure 10-3 on page 283 and Figure 10-4 on page 284.
—Spectrogram The signal is displayed is a real-time spectrum with a spectrogram bitmap. Spectrogram views are valuable in capturing signals that include both time and frequency variations. Refer to Figure 10-5 on page 284.
—Real-time Spectrum The signal is displayed as a real-time spectrum. Use real-time spectrogram to quickly display measurements. Refer to Figure 10-6 on page 285.
In all three spectrum measurements, there are four available traces for representation of the real-time spectrum.
Figure 10-3 Density Spectrum (Histogram) FM Signal with 1 MHz FM Deviation & 400 Hz FM Rate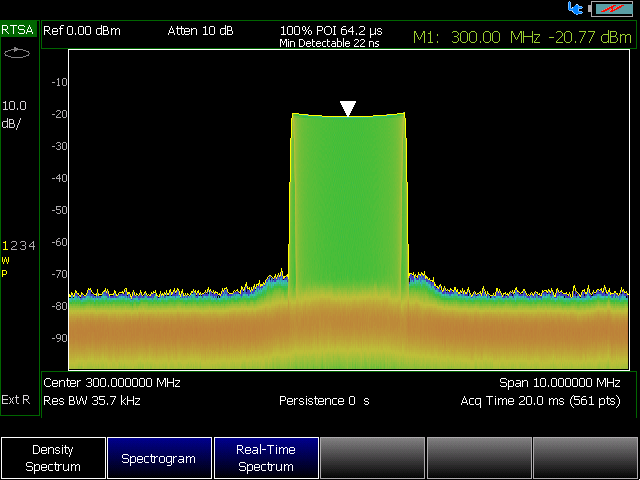
Figure 10-4 Density Spectrum (Histogram) with 2 Pulses, 100 MHz Span (Blue color indicates pulse that occurs less frequently)
Figure 10-5 Spectrogram (100 MHz Span)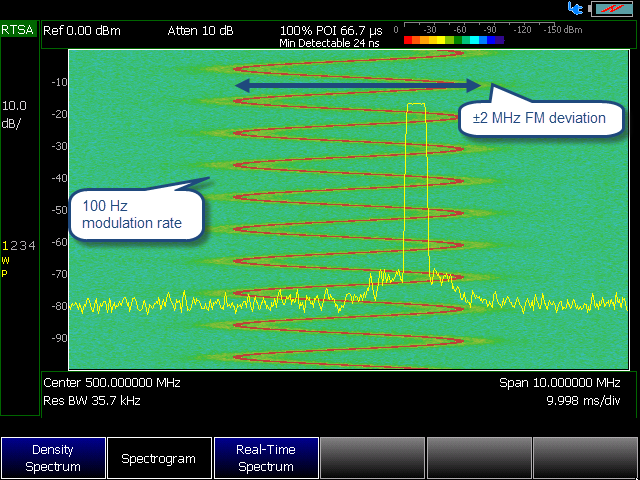
Figure 10-6 Real-time Spectrum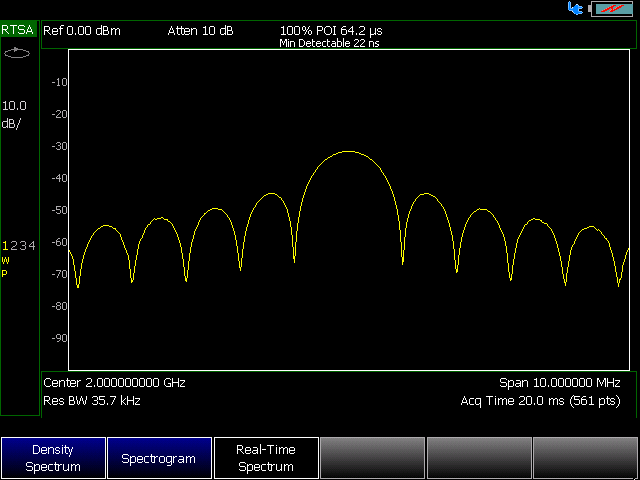
How to check or set the IF Path. By default the IF Path is set to Auto.
—Press BW 2.
—Then IF Path The underlined setting is the current setting. Choose Auto, 10 MHz, or 100 MHz (100 MHz requires Option B04 or B10 and either Option 350 RTSA or Option 351 IQ Analyzer).
Optional: After you click 100 MHz, you can use the Freq/Dist hard key and the number pad or using the numeric keypad, the When in full span, ADC dither raises the noise floor at the edges of the 120 MHz. arrows, to increase your IF path bandwidth to 120 MHz.
Resolution Bandwidth (Res BW)
In RTSA Mode, the Res BW provides the ability to resolve, or see closely spaced signals. The narrower (lower) the Res BW, the better the spectrum analyzer can resolve signals. In addition, as the Res BW is narrowed, less noise is measured by the spectrum analyzer ADC and the noise floor on the display lowers as a result. This allows low level signals to be seen and measured.
—Press BW 2.
—Then Res BW.
—Then choose from the following:
—Auto Res BW is coupled to the frequency span. As the frequency span is narrowed, the Res BW is also narrowed providing increased ability to resolve signals.
To change this setting from Man to Auto, press Res BW twice.
—Man Enter a Res BW value using the numeric keypad, the arrows, or the rotary knob. Then press a multiplier if necessary or press Enter
The current Res BW setting is shown at the bottom of the screen.
#Res BW x.xx XHz (#) means manual setting.
This setting could impact the accuracy of the measurement. See Specifications in Appendix B.
| Triggering only applies to Density Spectrum and Real-time Spectrum. |
External, Video, and RF Burst triggering enable you to initiate an RTSA mode sweep using an external event such as a signal burst.
Trigger Type
—Press Sweep 3
—Then Trigger Settings
—Then Trig Type
—Then choose from the following:
—Free Run Triggering is provided by the FieldFox internal circuitry. A new sweep begins when the previous sweep ends.
—External A sweep is triggered on an external TTL signal at the Ref In/Trig In connector on the FieldFox top panel. Choose to trigger on the rising slope at about 1.7 V or on the falling slope at about 1.0 V using the Trigger Slope setting (below).
—Periodic sets a trigger that repeats at the period rate entered. Periodic trigger's phase can be altered by the Offset value.
The following two selections are similar in that they both trigger a sweep from a signal at the SA RF Input connector. Experiment with both selections to find the best trigger type for your application.
—Video A sweep is initiated when the amplitude of an incoming signal crosses the settable trigger level. The comparison is done in the time domain, before conversion to frequency domain. Refer to “Trigger Slope”, “Trigger Delay”, “Trigger Level” on page 289, “Auto Trigger Time” on page 289, and to “Trigger Hold-Off” on page 290.
| If your trigger level is set too high for the current measurement gain setup, you will see an error message, similar to this one, displayed: “Video TrigLevel was HW Limited, it is x.xx dB above current capability”. Adjust your trigger level settings until the message is no longer displayed. |
—RF Burst A sweep is initiated when the signal at the third IF (analog) stage crosses the settable Trigger Level. This selection reacts to a wider bandwidth of the incoming signal than Video Trigger, which could be beneficial. However, RF Burst is not as sensitive to triggering on low-level signals. Refer to “Trigger Slope”, “Trigger Delay”, “Trigger Level” on page 289, “Auto Trigger Time” on page 289, and to “Trigger Hold-Off” on page 290.
—Periodic Trigger repeats at the period rate entered. Periodic trigger’s phase can be altered by the Offset value.
Then choose from the following:
—Period Enter a value for the trigger to repeat (100 ns to 400 ms).
—Offset Enter a offset value to offset the phase of the periodic trigger (–100 ms to 100 ms).
—Reset Offset Display Resets Offset to default 0.000000 s.
Trigger Slope determines which edge of an External, Video, or RF Burst trigger signal initiates a sweep.
—Press Sweep 3
—Then Trigger Settings
—Then Trig Slope
—Then choose from the following:
—Pos Sweep is triggered by the rising (positive) edge of signal.
—Neg Sweep is triggered by the falling (negative) edge of signal.
After a valid trigger signal is received, the sweep begins after the specified Trigger Delay time.
—Press Sweep 3
—Then Trigger Settings
—Then Trig Delay
—Enter a value using the numeric keypad, the arrows, or the rotary knob. (0 to 10 seconds)
—Then select a multiplier key or press Enter. Learn more in “Multiplier Abbreviations” on page 53.
Used with Video and RF Burst triggering, a sweep is initiated when an incoming signal crosses this level. See also “Scale and Units” on page 279.
RF Burst Trigger Level uses an alignment process which is performed in the background to set the detected signal level accuracy. Video Trigger Level is a comparison done on the time domain signal, before conversion to the spectral frequency domain. Processing from the time to frequency domain can cause broadband (e.g., pulsed) signal energy to display at lower power levels than the peak power levels of the time domain signal. Therefore you may need to the set trigger level higher than the displayed spectral level.
—Press Sweep 3
—Then Trigger Settings
—Then Trig Level
—Enter a value using the numeric keypad, the arrows, or the rotary knob. (–210 to 30 dBm)
—Then select a multiplier key or press Enter. Learn more in “Multiplier Abbreviations” on page 53.
Auto Trigger Time
While waiting for a valid trigger signal, Wait is annotated in the top left corner of the FieldFox screen.
If a valid trigger signal is not received before the specified Auto Trig Time, a sweep will occur automatically.
When Auto Trigger is OFF, the FieldFox does NOT sweep unless a valid trigger signal is received.
—Press Sweep 3
—Then Trigger Settings
—Then Auto Trigger
—Enter an Auto Trig Time using the numeric keypad. (1 ms to 100 seconds)
—Then select a multiplier key. See “Multiplier Abbreviations” on page 53.
—Enter 0 to set Auto Trigger OFF or press the Auto Trigger softkey a second time to turn OFF Auto Trigger.
Used with External, Video, and RF Burst triggering, sets the hold-off time between triggers. (Range: 0.000000 to 10.000000 seconds)
Once a trigger occurs, future triggers are ignored until the trigger hold-off time expires. Setting the trigger hold-off to zero, essentially turns off the trigger hold-off feature. Also, you can press Trig Hold-Off > OFF.
Trigger Settings Annotation
Trigger settings are annotated on the FieldFox screen as shown in the following figure:
—Trig Type (VidT), AutoTrigger (a), Pos Slope (/)
—Horizontal arrow: Trig Level (green horizontal graticule at -35 dBm)
Single / Continuous / Restart / Time Per Div
This setting determines whether the FieldFox measures continuously or only once each time the Single or Run / Hold +/- button is pressed. Use Hold / Single to conserve battery power or to allow you to save or analyze a specific trace.
| —To conserve battery power, in addition to using Hold / Single, you must also, set the System > preferences >Preferences > Battery Saver to On. For more, refer to the System Settings chapter and “Preferences” on page 870. |
How to set Single or Continuous
—Press Sweep 3.
—Then choose one of the following:
—Continuous
——ON Causes the RTSA to make continuous sweeps. This is the typical setting for making measurements. Each Run / Hold +/- press causes the RTSA to toggle between continuous sweep and Hold.
——OFF Causes the RTSA to Hold. Each Run / Hold +/- or Single press causes the RTSA to make ONE sweep, then Hold. The Hold annotation changes to an arrow --> while the sweep occurs.
—Single Automatically sets Continuous OFF and causes the RTSA to make ONE sweep, then Hold.
—Restart Resets the average counter to 1. If Continuous sweep is OFF, it also causes Average Count (n) sweeps to occur if any Trace State is set to RMS Average, MinHold, or MaxHold. This softkey is also used to clear the Spectrogram display. Learn more in “Average Count” on page 295.
Acq Time
Use the Acq Time setting to adjust acquisition time interval for each trace update in Density or Real-time Spectrum measurements.
How to set Acq Time
—Press Sweep 3.
—Then choose:
—Acq Time Acq Time affects the quantity of information being captured during a density or real-time spectrum measurement.
——Auto (default) the FieldFox chooses the optimum Acq Time based on the span setting (default is 20 ms, when span is set to full span).
——Manual enables user settable acquisition time values.
Points (not user settable)
Points is the number of measurements that are displayed along the X-axis. RTSA automatically sets the points to 821 and is not user settable.
Trace Display States (RTSA)
| You can use the FieldFox’s Remote Server mode (89600 VSA software connectivity) to parse playback files and captured data as MATLAB files (*.mat). Learn more about FieldFox and 89600 VSA software, refer to Chapter 18, “Remote Server Mode (Requires SA Option 233)” and to http://helpfiles.keysight.com/csg/89600B/WebHelp/89600.htm. |
In RTSA Mode you can display up to four of the following types of trace states. All RTSA trace settings can be independently reset (either automatically, or manually) for each trace counter (MaxHold, MinHold, or RMS Average) without resetting any other traces. These traces represent the Real-time Spectrum in each of the three measurement modes.
Additionally, this independent trace feature provides:
—annotates ONE such trace counter as the minimum trace count of all of the traces (even if multiple counters are active)
—automatically RESET any single Trace counter when parameter couplings dictate that a counter needs to be reset (e.g., TraceMode or TraceDetector changes)
—enables a user to manually reset a single Trace, via the Trace State menu selection (6 Trace > State)
—a manual reset is performed by pressing the same trace State again (i.e., trace state is already enabled), and the selection softkey says “Reset” or “Reset Count” as a hint to the user
Figure 10-7 Trace State Reset Softkeys
A color-coded legend for displayed traces is visible in the left pane of the RTSA mode screen:
W = Clear/Write; M = MaxHold; m = MinHold; A = Average; V = View
How to display the Trace States
—Press Trace 6.
—Then Trace 1,2,3,4 repeatedly to select a trace number to display or change its state. Traces are displayed in the following default colors (i.e., the colors are user settable):
—Trace 1 – Yellow Trace 2 – Blue
—Trace 3 – Orange Trace 4 – Green
—Then State [current setting]
—Then choose from the following Trace States:
—Clr /Wr [W] (Clear/Write) Displays the actual measured data for each sweep.
—MaxHold [M] Displays the maximum response of the input signal at each data point over multiple sweeps. See also Average Count in “Average Count” on page 295.
—MinHold [m] Displays the minimum response of the input signal at each data point over multiple sweeps. See also Average Count in “Average Count” on page 295.
—RMS Average [A] Each data point is averaged over multiple sweeps as set by the Average Count setting. Learn more in “Average Count” on page 295.
—View [V] Displays and then holds the last complete measurement trace on the screen. This is similar to storing a trace in memory.
—Blank Displays no trace.
—Press Default All to return all traces to their default settings: Trace 1 (Clear/Write); all other traces, including trace detectors (Blank).
In RTSA and SA Modes, the X-axis is comprised of data points, also known as “buckets”. Learn more in “Points (not user settable)” on page 291.
Regardless of how many data points are across the X-axis, each data point must represent what has occurred over some frequency range and time interval.
From the frequency span of the measurement, the span of each data point is calculated as (frequency span / (data points-1)). The detection method allows you to choose how the measurements in each bucket are displayed.
Using the RTSA feature, each of the four available traces can have an independent detection method.
How to set Detection Method
The current Detection method for each trace is labeled on the left edge of the screen. A corresponding letter appears below the corresponding Trace number selected. For example: N means that Normal was the selected detector.
1.Press Trace_6 > Detector
2.Then choose from the following:
—Auto [...] Displays the most appropriate Detection method based on other settings. [No annotation]
—Normal [N] Provides a better visual display of random noise than Positive peak and avoids the missed-signal problem of the Sample Mode. Should the signal both rise and fall within the bucket interval, then the algorithm classifies the signal as noise. An odd-numbered data point displays the maximum value encountered during its bucket. An even-numbered data point displays the minimum value encountered during its bucket. If the signal is NOT classified as noise (does NOT rise and fall) then Normal behaves equivalently as Positive Peak.
—Positive Peak [P] Displays the maximum value of all the measurements in each bucket. This setting ensures that no signal is missed. However, it is not a good representation of the random noise in each bucket.
—Negative Peak [p] Displays the minimum value of all the measurements in each bucket.
—Sample [S] Displays the center measurement of all the measurements in each bucket. This setting gives a good representation of the random noise in each bucket. However, it does not ensure that all signals are represented.
—RMS Average [A] Displays the Root Mean Squared (RMS) average power of all the measurements in each bucket. This is the preferred method when making power measurements.
Repeat the detection setup process as needed for up to 4 traces and 4 detection methods.
Average Count, Show Density, Blue, and Red Percentage Limits
How to set:
—Press Meas Setup 4
Then choose one of the following:
—Average Count – Changes the quantity of traces averaged for certain trace states (i.e., MaxHold, MinHold, or RMS Average). Refer to “Average Count”.
—Show Density – (Density Spectrum Only) Displays a histogram image of the traces.
—Blue Limit % – (Density Spectrum Only) Changes the percentage of the trace that has a blue limit (0.05% to 100%, default is 0.05%). This setting is coupled to the color bar in the upper right corner of the FieldFox display.
—Red Limit % – (Density Spectrum Only) Changes the percentage of the trace that has a blue limit (0.05% to 100%, default is 100%). This setting is coupled to the color bar in the upper right corner of the FieldFox display.
—Blue Limit dBm – (Spectrogram Only) Changes the power level (dBm) of the trace that has a blue limit (–210 dBm to 30, default is –90 dBm). This setting is coupled to the color bar in the upper right corner of the FieldFox display.
—Red Limit dBm% – (Spectrogram Only) Changes the power level (dBm) of the trace that has a blue limit (–210 dBm to 30, default is –50 dBm). This setting is coupled to the color bar in the upper right corner of the FieldFox display.
| Blue limit and red limit percentages are coupled to the density percentage limit bar in the upper right of the FieldFox display. Or, for the blue limit and red limit power levels (dBm) are coupled to the Spectrogram power level (dBm) limit bar in the upper right of the FieldFox display. |
Average Count
The Average Count setting is used mainly with the RMS Average Trace State described in “Trace Display States (RTSA)” on page 292. (But, also applies to the MaxHold or MinHold trace states.) In the RMS Average Trace State, the Average Count setting determines the number of sweeps to average. The higher the average count, the greater the amount of noise reduction.
For all three of these Trace States (RMS Average, MaxHold, or MinHold), when Sweep 3 Continuous is set to OFF, press Restart to reset the sweep count to 1, perform <n> sweeps, then return to Hold.
—Then Average Count
—Enter a value from 1 to 10,000 using the numeric keypad, the arrows, or the rotary knob.
—Press Enter
The RTSA mode requires all three alignment types: amplitude, RF burst, and channel equalization. Refer the SA chapter’s “Alignments” on page 219 for information on all Alignments.
A display line is a simple, horizontal line that can be placed at any amplitude level on the RTSA screen. Use a display line as mental guide for visual feedback.
Figure 10-8 Display Line with Annotations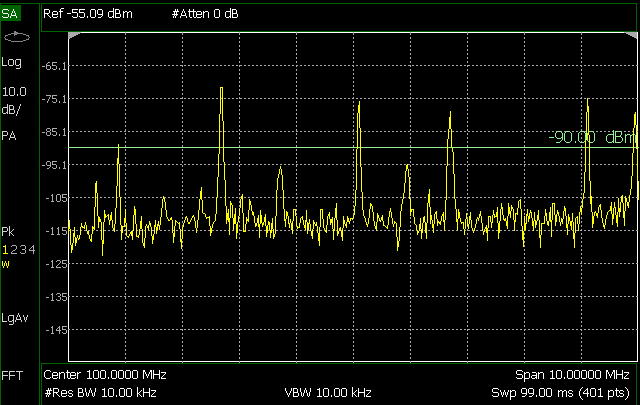
How to create and move a Display Line
—Press Limit __8
—Then Display Line OFF ON
—Then enter a Y-axis value using the arrows or the rotary knob, then press Enter. Or enter a value using the numeric keypad and press a suffix key or press Enter.
Learn more, “All about Limit Lines” on page 834.
For more on using limit lines, refer to Chapter 30 and to “All about Limit Lines” on page 834.
When enabled, the Audio Beep feature emits a repetitive beep sound which varies in tone pitch and repetition rate to indicate the relative power level of the active marker. The highest tone pitch and fastest beep rate occurs when the marker Y-axis position is at the top of the display. Conversely, the lowest pitch and repetition rate occurs at the bottom of the display. Therefore, it is important to scale the signals that you intend to measure between the top and bottom of the screen. Learn more about Scale in “Scale and Units” on page 279.
Audio Beep can be used with any marker type or function, including Band/Interval Power. Learn more in “Audio” on page 876.
How to use Audio Beep
1.Press Marker
2.Optionally, press Marker 1 2 3 4 5 6 to select an existing marker to use with Audio Beep. A marker will be created if one does not already exist.
3.Then More > Audio Beep ON OFF
Audio Beep does NOT beep when the FieldFox is in Hold mode.
While Audio Beep is ON, press Marker 1 2 3 4 5 6 to toggle Audio Beep through the existing markers.
To set FieldFox speaker volume control, press System, then Volume. Learn more in “Audio” on page 876.
Spectrogram display provides a visual history of the measured spectrum. This display type can be used to locate intermittent signals or to view signal levels and frequencies over time.
This display can NOT be used with Channel Measurements.
Spectrogram Display (RTSA Option)
Spectrogram draws the most recent trace record at the bottom of the stack of previously-drawn trace records. Drawing the live trace on the display is optional.
Figure 10-9 Spectrogram display- Overlay view
How to select Spectrogram
—Press Meas 1
—Then Spectrogram
How to modify the Spectrogram
You can change how the spectrogram is displayed relative to the data trace. This setting affects the total number of trace records that can be displayed.
For RTSA Mode:
—Press Meas Setup 4.
—Then Spectrogram View
—Then choose from the following:
—Overlay Displays the data trace over the spectrogram with NO graticules. Total trace records: 340.
—Top Displays the data trace below the spectrogram. Total trace records: 130.
—Bottom Displays the data trace above the spectrogram. Total trace records: 130.
Common Settings for Spectrogram
The colors displayed on the Waterfall and Spectrogram represent the various measured power levels:
—Red = Highest power levels
—Blue = Lowest power levels
| The full Red-to-Blue color spectrum is visible only with Indoor display colors. Learn more in “Display Colors” on page 860. |
Adjust the Red and Blue limits to the power levels that you expect to measure.
The Blue limit must always be less than the Red limit.
For RTSA Mode:
—Press Meas Setup 4.
—Then choose from the following:
—Red Limit Using the arrows, rotary knob, or keypad, select the HIGHEST power level that you expect to measure. This power level, and those measured higher than this level, appear Red.
—Blue Limit Using the arrows, rotary knob, or keypad, select the LOWEST power levels that you expect to measure. This power level, and those measured lower than this level, appear Blue.
How to Restart the Spectrogram
Press Sweep 3 then Restart
Record/Playback (RTSA Option)
| Density Spectrum information is not recorded. Only the trace data is saved. See “How to Record a Session” on page 303. |
| Record/Playback is only available in Density Spectrum and Real-time Spectrum measurements. Record/Playback is NOT supported on Spectrogram. See “How to Record a Session” on page 303. |
Record Playback allows you to record RTSA trace sweeps and play them back at a later time. Use this feature to monitor spectrum activity over a period of time.
You can record traces continuously or record a specified number of traces (segments).
When GPS is enabled, the current location and elevation are saved and played back with traces.
Recordings can be saved to the FieldFox Internal memory, an SD Card, or a USB flash drive.
A Recording Session is a collection of recorded traces and the instrument states that generated them.
Before recording can occur, a new session must be initiated or an existing session must be opened. Sessions can later be opened for playing or continued recording. Only one session can be open at a time.
You close the session when finished recording or playing. A session is also closed when the FieldFox is Preset (or Mode Preset), an Instrument State is recalled, or when Mode is changed from RTSA.
Each session is saved as a folder containing a set of files on the specified storage device.
How long can a recording session last?
There are many variables that determine the possible length of a recording session. But one key variable is the amount of available memory.
When a session is opened or a new session is initiated, an estimate is made of the maximum number of traces that can be saved based on the available disk space and the current number of data points (resolution). Recording will stop when that number is reached. This estimate always keeps 4 MB of available disk space on the specified storage device. You can decrease the number of traces to further limit recording.
To maximize the amount of space that is available, save recorded traces to a USB Flash drive or SD card. Learn how in “Manage Sessions” on page 307.
You can determine the length of time over which recording can occur by setting the Record Interval (the time between recorded traces) and other settings. Learn more in “Recording Configuration” on page 305.
To view and edit the maximum number of records
Just after opening or initiating a session:
1.Press Session Data
2.Press CSV SaveStyle <n> (n = Max number of traces that can be recorded).
3.Press TraceRecordLimit <SingleTrace> (Default == SingleTraces).
— SingleTrace – just a single trace is saved as a record.
—RangeTraces –
—AllTraces – All active traces are recorded.
4.Optional: Clear All Records Empties that session of recorded traces. Learn more in “Manage Sessions” on page 307. IMPORTANT! Pressing Clear All Records causes a loss of ALL of the session data. 
FieldFox Setting Changes during Record and Playback
During Recording
When any of the following State settings are changed during recording, the State counter is incremented (“About State and User Tags” on page 302) and the settings are saved to the Session file along with the first trace to be recorded with the new setting. During playback, the trace and display annotation will reflect the change on the screen.
State settings:
Refer to Table 10-1 on page 302 for a list of the applicable state settings for the RTSA options.
Option | Settings |
|---|---|
RTSA | |
Acquisition Time | |
Detector(s) | |
External Gain | |
Frequency Range | |
Preamp On/Off | |
Resolution BW | |
RF Attenuation | |
Trace State(s) | |
Trigger Settings |
Other display settings, such as Scale and acquisition, can also be changed during recording but are not saved with the session file. Think of these as settings that help YOU see the recording and playback activity. They do NOT change the data that is recorded.
During Playback
Changes to the states listed above are NOT allowed during playback.
However, all other display settings can be changed during playback to help you analyze the recorded data.
In RTSA mode, trace recordings are played back as is and the Trace State cannot be modified. No measurement post processing is allowed, and no Density or Spectrogram information can be recovered. This is because RTSA’s Real-time Spectrum and Density displays are not derived from the trace data, but instead require independent high speed hardware acquisition.
Record/Playback Exceptions
Markers can be activated and moved to help analyze recorded data. However, marker position control is only available when playback is Paused.
When any of the State settings (listed above) are changed during a recording, a ‘state tag’ is inserted at the first trace number to be recorded with the new setting.
In addition, you can insert a ‘User Tag’ at any time during a recording session to indicate an external event, such as when an antenna is moved. During playback, you can move quickly to any of these tags, or scroll through these tags.
A symbol is used on the screen annotation to distinguish a User Tag from a State Tag when scrolling through tags during playback.
Screen Annotation
During a record or playback session, the following is displayed in the top-left area of the screen:
— AutoSession02: 92/95 (state 4/5)_*_
Sep.22.2018 09:15:15 AM
where:
—AutoSession is an auto-generated name for sessions. 02 is the auto-generated number, incremented with each new session. The name can be changed using Manage Sessions. Learn more in “Manage Sessions” on page 307.
—92/95 is the current and total trace number: currently trace is 92 of 95 total traces.
—state 4/5 is the current and total state tag or user tag number: 4 of 5 total tags.
—* (Asterisk) indicates that a state has changed. # (Pound) indicates that a User Tag has been inserted.
—Sep.22... is the date and time of recording.
When GPS is enabled` , the current location and elevation are annotated at the bottom of the playback display. Learn more in “GPS – Distance Settings” on page 877.
| If Recording or Playback is not occurring when you think it should, check the following: —Is the sweep in HOLD? (upper-left annotation), or check the Sweep menu for Continuous set to OFF. —Is Recording or Playback Paused? (mid-left annotation) —Is the Record or Playback Interval set too long? (Configuration settings.) |
1.Press Trace 6 > Record Playback
2.Then either:
—New Session OR
—Recall Session then Open and select a session.
3.Press Recorder Player
4.Press Record
REC is displayed in the left of screen graticules.
During recording, choose from the following:
—Pause Resume Temporarily halts recording until pressed again. The incoming trace continues to sweep. Press again to continue recording.
—Stop Immediately stops recording. Then choose from the following:
—Press Play to start replaying the recording from the beginning.
—Press Record to continue recording.
—User Tag Press to insert a User Tag at the current recorded trace. This allows you to quickly move to this location during playback. Learn more in About State and User Tags in “About State and User Tags” on page 302.
1.Press Trace 6
2.If the session is already open, skip the following step. Otherwise:
3.Press Record Playback Setup
—Press Recall Session Then select a session to playback and press Open.
| If these are large recordings on a device, it could take several seconds for the FieldFox to display the list. |
4.Press Recorder Player
5.Press Play
PLAY is displayed in the left of screen graticules during playback. When the end of the recording is reached, playback begins again at trace 1 and continues to loop indefinitely.
During playback, choose from the following:
—Pause Resume Temporarily halts playback. Then choose from the following:
—Pause Resume Press to continue playing.
—Playback State/Tag Allows you to continue playback from a state tag, or scroll through the state tags. Enter a value between 1 and the total number of state tags using the numeric keypad, arrows, or the rotary knob. Active when playback is paused. Learn more in About State and User Tags in “About State and User Tags” on page 302.
—Playback Trace Activated automatically when Paused. Allows you to continue playback from a specific trace, or scroll through traces manually. Enter a value between 1 and the total number of traces using the numeric keypad, arrows, or the rotary knob.
—Stop Immediately stops playback. Then choose from the following:
—Play Start playback from trace 1.
—Record Resume recording from the last recorded trace.
—Record Playback Setup Return to the setup menu to change Configuration settings or Close the session.
To change Recording Configuration settings:
1.Press Trace 6 > Record Playback
2.Press New Session or Recall an existing session.
3.Press Recording Configuration
4.Then choose from the following:
—Record Time Sets the amount of time to record traces. Default is MAX, which is to record indefinitely. Enter a value between 1s and 1 Ms (million) seconds using the numeric keypad, arrows, or the rotary knob. When set, a timer appears during recording in the lower-left corner which counts DOWN from the specified time.
—Record Source Determines which trace is recorded. Sets where, in the FieldFox data flow, data is recorded. Learn more in “Record Source” on page 306. Choose from the following:
—First Active Trace (Default) This setting automatically selects the first active trace (1,2, 3 or 4) (i.e., any state other than View or Blank).
—Trace 1,2,3,4 Records data from the corresponding trace in its current state.
—Record Interval Sets the amount of time to wait between individual trace recordings. Default is MIN, which is to wait 0 seconds (record traces as fast as possible). Enter a value in seconds between 0 (no delay) and 10,000 seconds - about 3 hrs) using the numeric keypad, arrows, or the rotary knob.
—Segment Count Sets the number of traces to record, after which the recording will automatically pause. Press Pause/Resume or Record to capture another N traces, or Stop to end recording. Default is OFF, which is NO limit to the number of traces to be recorded.
When set, a counter appears in the lower-left corner which counts UP to the specified number of recordings.
| For this discussion, it is important to understand Trace States. Learn more in “Trace Display States (SA mode)” on page 213. |
Figure 10-10 FieldFox RTSA Mode: Data Flow and Record Playback Data Points
RTSA Data Recording: Density Spectrum information is not recorded. Only the trace data is saved.
—Data is recorded at the trace state processing block.
—Data can be recorded from Traces 1,2,3, or 4 which includes the trace state (Max Hold, Min Hold, and so forth).
—Data is ALWAYS played back into the same trace number that was recorded. If four traces were active during the recording, but only one trace was recorded, then during Playback only that one recorded trace is visible.
By default, trace sweeps are played back as fast as the trace can be drawn on the screen. The following setting allows you to slow playback. In addition, you can manually scroll through individual traces using Playback Trace, or scroll through State and User Tags using Playback State/Tag. Learn more in How to Playback a Session in “How to Playback a Session” on page 304.
To slow playback of a session:
1.Record a new session or Open an existing session.
2.Press Playback Configuration
3.Press Playback Interval
4.Enter a value in seconds between 0 (no delay) and 100 using the numeric keypad, arrows, or the rotary knob. After using the keypad, select a multiplier key. Learn about multiplier abbreviations.
5.Press Enter
1.Press Trace 6 > Record Playback
2.Press Record Playback Setup The following selections are available ONLY when a session is NOT open.
3.Press Storage Device to select the media which stores the sessions to be managed. This is a different setting from the Save/Recall Storage Device setting.
4.Choose from the following:
—Internal FieldFox memory (default)
—SD Card An external SD Card (must be inserted)
—USB An external USB flash drive (must be inserted)
5.Press Manage Sessions
| If these are large recordings on a device, it could take several seconds for the FieldFox to display the list. |
6.Choose from the following:
—Rename Using the FieldFox labeler, change the name of the session. AutoSession (n) is the default name where (n) is the next-available number. Learn more in “How to use the FieldFox labeler ” on page 916.
—Sort Arrange the listing of sessions by Name, by Date, or by Size. Sort can also be used during a Recall Session, before choosing a session to open.
—Delete After a confirmation prompt, removes the contents of the selected session from the list.
—Copy Copies the selected session to a different storage device, or the same storage device with ‘Copy(n)_’ appended to the beginning of the name so that duplication is prevented.
—Copy All Copies ALL of the listed sessions to a different storage device, or the same storage device with ‘Copy(n)_’ appended to the beginning of the names so that duplication is prevented.
—Delete All Deletes ALL of the listed sessions.
Record Playback Example (RTSA Mode Only)
The following “Interval Recording” example shows how you can record spectral activity over a longer period of time with less trace storage.
1.Press Trace 6 > Record Playback > New Session > Recording Configuration
2.Press Record Source to Trace1
3.Press Back > Recorder Player
4.Press Record let the recorder run for several seconds.
5.Press Stop to end the recording.
This session can be played back: For example:
—Press Trace 6
—Then Record Playback
—Then Play