Transmission Line and Free Space Method - Opt. 001, allows measurements
of the complex permittivity (![]() , epsilon)
and permeability (
, epsilon)
and permeability (![]() , mu) for a wide range of solid materials.
It performs all of the necessary network analyzer control, calculation,
and data presentation functions.
, mu) for a wide range of solid materials.
It performs all of the necessary network analyzer control, calculation,
and data presentation functions.
In this topic:
See Also: All Opt. 001 Topics
The following are the basic sequence of steps you would follow to complete a calibrated measurement. Keep reading below to see details of these steps.
Click Measure, then Define Measurement to setup the analyzer.
Perform a 2-port calibration on the analyzer. See the analyzer's documentation to learn how. The N1500A software guides you through a 2nd tier Freespace GRL Calibration. Learn more).
Click Measure, then Trigger measurement to perform a measurement of the DUT.
Click Chart to make various settings for analyzing the measurement data.
Click File to save and recall Measurement Setup and Data.
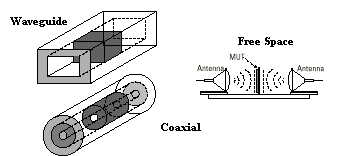
Each type of “transmission line” requires a different shape sample and sample holder.
Choose the sample shape in the Define Measurement, Sample Holder dialog and Sample and Sample Holder Considerations
Transmission Line |
Sample Shape |
Sample Holder |
waveguide |
brick-shaped |
Section of waveguide transmission line |
coax |
donut-shaped |
Precision connector (such as APC-7) at each port and a precision center conductor |
Free space |
flat |
Fixture to hold sample |

The software requires that you manually calibrate the network analyzer measurement system before making a measurement. Calibration removes measurement uncertainties from the system. If possible, calibrate with the sample holder connected to PORT 2. (See Calibration Considerations).
After calibration, minimize changes to the measurement system such as cable movement and temperature variations. More detailed information on the calibration process can be found in the network analyzer’s documentation.
After calibration, the network analyzer measures the S-parameter of the sample holder and sample material. The measurements may be reflection measurements, transmission measurements, or both. The raw measurements of the sample holder and sample material are then vector error corrected using the system error model obtained during the calibration process. The correct S-parameters are transferred to the computer.
The computer mathematically rotates the S-parameters through the appropriate lengths of transmission line. These lengths are input to the software as part of Measurement Definition. At this point the S-parameters represent the S11 and S22 input reflection coefficients at the sample interfaces, the S21 and S12 transmission through the sample, or both. The software uses the S-parameters at the sample interface to calculate the complex permittivity and permeability.
Various mathematical models are available for converting the S-parameters of the material sample to permittivity and permeability. Descriptions of each model are presented in Software Reference. Some of the models use iterative calculation routines. As with all iterative routines, it is important to provide an estimate of the solution to start the calculation. The software has built-in algorithms for obtaining estimates to start the calculations. Unpredictable results can be overridden with the verify estimate command in the Measure menu. This presents the estimate that the software is using when making the materials parameters calculations at the first frequency. If incorrect, the estimate may be overridden at this point.
Beginning with version 2020, the N1500A computes the uncertainty of the material parameters extraction (supports NRW measurement model only). The uncertainty computation takes into account:
The uncertainty has been computed in a fully correlated way and it can be stored and retrieved. Furthermore new plot types with uncertainty error bars or shaded region have been added.