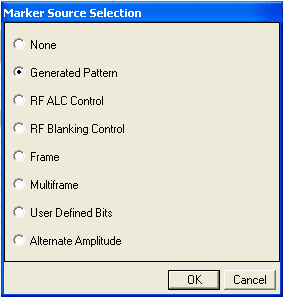
Use the Marker Source Selection dialog window for the to cells to set active marker points in the waveform. The cells are located in the WFMn parameter configuration table.
When Parameter Optimization in the Instrument node is set to , Marker 3 and Marker 4 source selection in the Waveform Setup node and the marker routing selected in the Dual Arb Marker Utilities are overridden.
To manually set Marker 3 and Marker 4 source, the marker routing, or both, set the Parameter Optimization to .
To select the marker source, click the appropriate radio button in the dialog box.

|
Marker Source Selection Window |
|---|
All marker points are set to zero (inactive).
The software sets the marker high (1) for the first five samples of the waveform. See Marker 1 in the instrument waveform marker display, below.
For a bursted waveform, the marker is set between the amplitude ramp up and ramp down period. For the selected marker, the software sets the bits high during the on part of the pulse. The instrument samples the pulse's amplitude for the duration for the set bits and holds the ALC level during the off portion of the signal. To enable the RF ALC Control, use the 2.Marker function table found in the WFMn's view. See Marker 3 in the instrument waveform marker display below.
Marker 3 is set for a shorter period than Marker 4.
If the waveform has multiple power levels, the marker is set only during the period when the amplitude is set to 0dB.
This increases the RF attenuation when the signal content of the calculated waveform is 0. See Marker 4 in the instrument waveform marker display below.
The marker is set at the beginning of the modulated data (the tail bits of timeslot 0) in the signal. See Marker 2 in the instrument waveform marker display, below.

This selection applies to only Option QFP advanced waveforms. It generates a marker at the beginning of the selected multiframe period (13, 26, or 52). To use with multiple advanced carriers, select as the marker source for each carrier. The software then automatically determines which carrier has the longest multiframe period and outputs the marker for only that carrier (longest multiframe period).
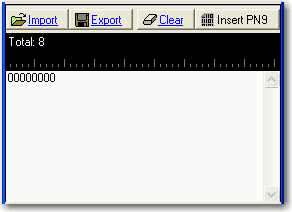
This selection opens the user data entry area, which lets you customize the marker signal. For example, you can define a marker signal to control the timing of biasing for an amplifier. See Applying User Defined Bits.

The user data area contains buttons to import, export, or clear user marker data and provides the ability to insert a PN9 sequence for the marker bits. You can also manually insert or delete marker data. To manually insert marker data, place the cursor within the data entry area and insert data using one of the following methods:
use the 1 (marker active) and 0 (marker inactive) keys on the keyboard
paste data from a file or from within the current view
(You can use the keyboard shortcuts + and + for copying and pasting.)
To delete data, place the cursor at the desired location within the data and press the key or use the keyboard short cut +.
The number of marker bits for a given waveform must equal the value shown in the Waveform Length cell.
If you create a file larger than the software uses for the waveform, the software truncates the excess marker bits. Conversely, if there are not enough marker bits, the software repeats the marker bit pattern until there are enough marker bits to match the Waveform Length cell value.
 Click this button to open a dialog box in which you
can navigate to and import a pre-defined pattern file. The imported file
automatically updates the user data entry area. The software accepts the
following file types:
ASCII text
comma separated values (csv)
binary
 Click this button to open a dialog box in which you
can save the current data pattern to a file of the following file types:
ASCII text
comma separated values (csv)
binary
 Click this button to clear all data displayed in the user data entry area.
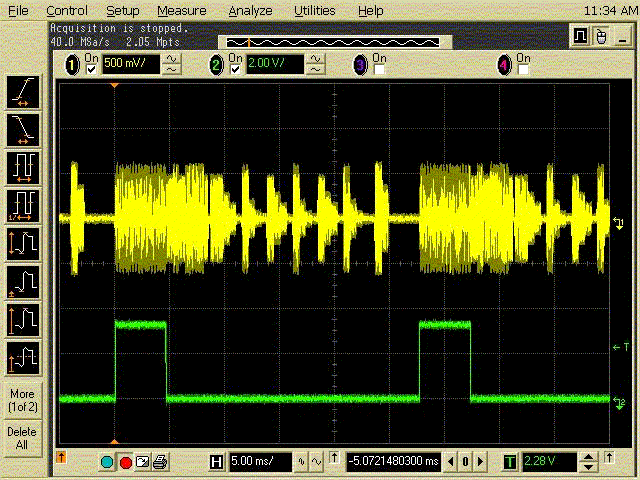
Marker 1 is used in the following example. The instrument routes the Marker 1 signal to the rear-panel EVENT 1 output. See WFMn Node.
By using a data pattern the same length as the waveform, User Defined Bits can be used to precisely control when the Event 1 output is turned on and off.
You can mark the start of a waveform sequence by assigning a ”r;1” to Marker 1 in the first waveform in the sequence. The bottom trace in the plot below shows where this has been done.

If a user defined pattern is shorter than the waveform, it is repeated. For example, Marker 1 in the instrument marker display below shows a repeated ”r;10” data pattern.

The Timeslot's Main Amplitude, Alternate Amplitude buttons, and timeslot graph are available in the WFMn node. The timeslot graph indicates the timeslot's status (Main Amplitude, Alternate Amplitude, or None (i.e. amplitude unleveled) for each of the corresponding Timeslots, Timeslot0 to Timeslot7. The timeslot buttons can be used along with the drop down arrows in the 2. Marker and 3. Power function tables to set the Alternate Amplitude settings. Refer to Amplitude, Markers, and Timeslot Graph.
It is not recommended that the Alternate Amplitude function be used with waveform sequences. If the Alternate Amplitude function is used with waveform sequences, the last waveform in the sequence's result is used to calculate the Alternate Amplitude settings and is then applied to all of the other waveforms in the sequence. This behavior may or may not be correct for all the other waveforms in the sequence.
When using the Alternate Amplitude function, do not attempt to use the timeslot power in the Timeslot node, to adjust the timeslot's power. The Alternate Amplitude feature has priority over the Timeslot node's Power parameter.
The alternate amplitude function is unique to the ESG E4438C with standard electronic attenuator (not compatible with Option UNB mechanical attenuator or Option 506). Refer to the ESG E4438C's Data Sheet and the User's Guide.
The Alternate Amplitude function is not compatible with the MXG, EXG, EXT, or PXB.