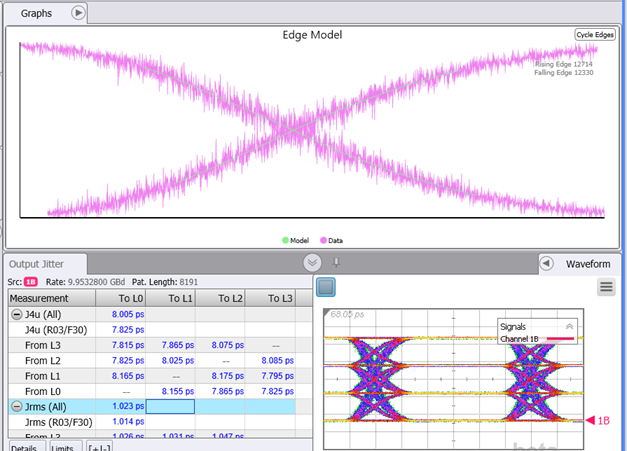
Edge Model Graph
The Edge Model graph provides additional insights into Jitter Mode measurements for both NRZ and PAM4 waveforms. To view the graph, click Tools > Jitter Diagnostics followed by Auto Scale. For PAM4 waveforms, click on the Meas tab and click the 12-Edge Output Jitter before performing the Auto Scale. This additionally displays the Output Jitter table.
This graph is provided as an aid to those who want to understand more fully the measurement algorithms described in Jitter Measurement Algorithm. Normally, there is only one set of edges displayed on the graph. However, if the pattern length is even, the Cycle Edges button is shown on the graph which allows you to toggle the view to another set of edges.
