Interpolation Operator
 The Interpolation operator adds new points between each of the input waveform's points and can be used to reconstruct a band-limited signal. This operator is designed for use on single-valued waveforms and not eye diagrams.
The Interpolation operator requires a single-valued waveform, as opposed to an eye diagram. Be sure that your trigger setup results in a single-valued waveform at the input to this operator. This can be acheived using an external pattern trigger or by using pattern lock. If you are using an external pattern trigger, you may ignore this note.
The Interpolation operator is not available in Jitter mode.
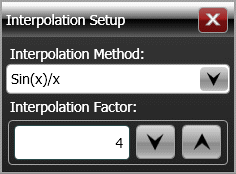
You can select a linear or sin(x)/x Interpolation Method. The sin(x)/x method is the default and is preferred when reconstructing a signal (having evenly spaced samples) that has been bandlimited. The new points are evenly spaced between the original points. The number of points in the output waveform is determined by the Interpolation Factor, which can be set to values of 2, 4, 8, 16, 32, or 64. The relationship between the number of input and output waveform points is shown in the following equation:
- output waveform points = AX − A + 1
where X is the number of input waveform points and A is the interpolation factor.
As an example, specifying an interpolation factor of 8 for a 100 sample-point waveform results in a 793 point output waveform:
- output waveform points = 8(100) − 8 + 1 = 793
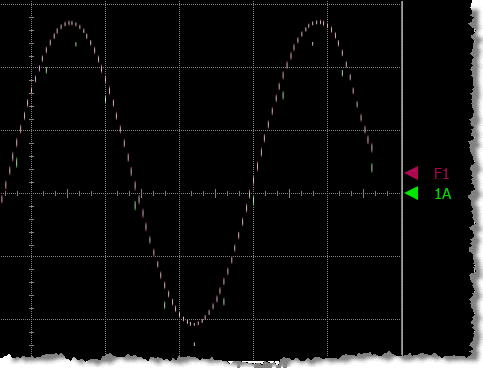
The following figure shows an output waveform constructed using an interpolation factor of 8. The input waveform (1A) is shown with 13 sampled green points. The red points show the output waveform (F1).
The operator's Display Setup configures the manner in which the resulting waveform is displayed including both vertical and horizontal scaling. Track selection to allows the output waveform to track changes to the scaling of the input waveform. Track is the default setting. In addition, you can turn the waveform's display off or on and select the color of the trace.
Use the Name button to give the displayed waveform a custom identifying name which is show in the Signals area on the display graticule and in the Signals palette. Custom names are very helpful for screen captures or when multiple waveforms are displayed.
The Graph Window is available when multiple waveform content windows are used.
Use the Signal Type's Track selection to allows the waveform type (NRZ or PAM4) to track the input waveform's type. Track is the default setting. If input waveform's type cannot be automatically determined, select Manual to specify the waveform type.