Waveform Content Windows
Waveform Content Windows
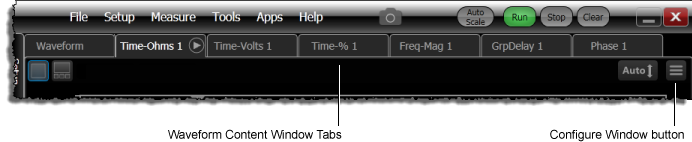
Different types of waveforms are displayed in dedicated waveform graph tabs as shown in this picture. These windows graph specific types of waveforms and their available depends upon waveform type and instrument mode. Click the Configure Window button identified in this figure to quickly view and scale waveforms, to apply tracking markers, and to display the Signals legend. Settings that you make are applied to the currently selected waveform window tab.
The available waveform content windows are:
- Waveform
- Freq-Mag (output of FFT operator)
- Phase (output of FFT operator)
- GrpDelay (output of FFT operator)
- Graphs (Jitter Mode graphs)
- Time-Ohms (TDR Mode)
- Time-Volts (TDR Mode)
- Time-% (TDR Mode)
The Waveform window displays channels, the output of most functions, Eye/Mask Memory, and Waveform Memories (other than TDR/TDT waveforms). In TDR/TDT mode, S-parameter waveforms and T-parameter waveforms.
Configure Window Dialog
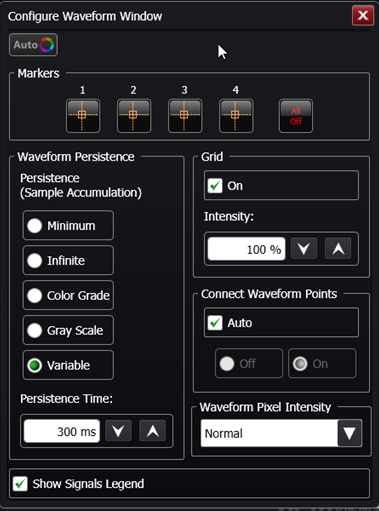
When you a click the Configure Window button, the Configure Waveform Window dialog is displayed as shown here. Use the Markers field to quickly place a tracking marker on a displayed waveform. The remaining fields provide quick access to selections that are available on the Graticule tab of the Display Setup dialog.
Click Show Signals Legend, which is located at the bottom of the dialog, to hide or view the signal legend. The Signals legend identifies the displayed waveforms as shown here:
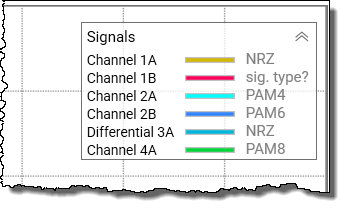
Here are some examples of identified waveforms. The text shown in italics is not displayed in the legend:
- Channel 2B
- Differential 3A
- Memory 1 (waveform memory)
- Eye Memory 2 (Color-Grade/Gray Scale Memory)
- Jitter Memory (Jitter Mode)
- F2:FFT[1A] (FFT operator's output waveform)
- SDD11 (TDR Mode's s-parameter waveform)
- T22 (TDR Mode's time-domain parameter waveform)
The legend also lists the type of waveforms in Scope, Eye, and Jitter modes:
- NRZ
- PAM4
- PAM6
- PAM8
- UNSP (unspecified)
Configure Window Pane for Time-Ohm, -%, -Volts Windows
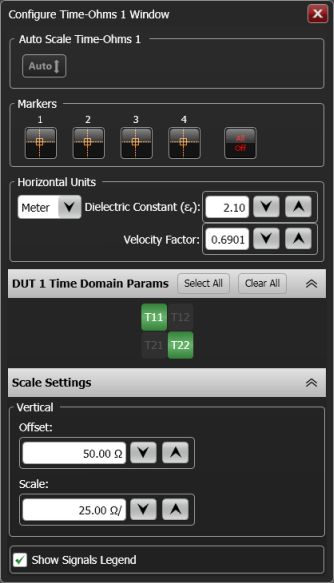
This picture shows the settings available for Time-Ohms, Time-Volts, and Time-% versions of the Configure Window pane. These time-domain windows are used to show TDR/TDT mode's T-parameters.
Auto Scale
Click the Auto button to scale the graph's vertical axis.
Markers
Use the Markers field to quickly place a tracking marker on a displayed waveform.
Horizontal Units
In the Horizontal Units field, you can select Seconds or Meters. Seconds is the default settings. When Meters is selected, you can accurately scale the graph's X-axis to account for the velocity of propagation through the DUT path. This is accomplished by entering either the DUT path's Dielectric Constant (εr), also known as Relative Permittivity, or the Velocity Factor.
DUT Time Domain Params
Use the DUT Time Domain Params field to turn on and off the display of available waveforms. You may need to click on the gray title bar to expand this field for view.
Scale Settings
Use the Scale Settings fields to change the graph's Vertical scales. You may need to click on the gray title bar to expand this field for view. Because the scaling for the horizontal axis is linked to the scaling for the standard Waveform window, click on the Timebase button that is located at the bottom of the application window to change the graph's horizontal scale.
Configure Window Pane for Freq-Mag, GrpDelay, Phase Windows
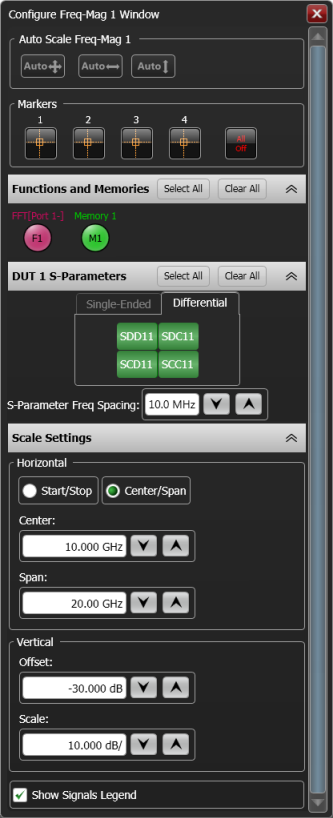
This picture shows the settings available for Freq-Mag, GrpDelay, and Phase versions of the Configure Window pane. Use the Markers field to quickly place a tracking marker on a displayed waveform.
Auto Scale
Click the Auto buttons to scale the graph's vertical axis, horizontal axis, or both axis.
Markers
Use the Markers field to quickly place a tracking marker on a displayed waveform.
Functions and Memories
The Functions and Memories field is present if:
- An FFT math function is active and its output is not selected to be Linear Magnitude.
- A frequency-domain waveform has been saved to waveform memory.
Click the FFT and Memory buttons to turn on and off the display of these waveforms. You may need to click on the gray title bar to expand this field for view.
DUT S-Parameters
The DUT S-Parameters field is present if TDR/TDT mode is active and S-parameters are available. Use the S-Parameter Freq Spacing field to change the frequency spacing used on the graph. This is the only location in FlexDCA where you can change this setting. You may need to click on the gray title bar to expand this field for view. Click the S-Parameter buttons to turn on and off the display of these waveforms.
Scale Settings
Use the Scale Settings fields to change the graph's Horizontal and Vertical scales. You may need to click on the gray title bar to expand this field for view.
Table of Content Window Features
As noted in the following table, in certain situations multiple waveform content windows of the same type can be created. For example, in TDR/TDT mode there could be created Phase 1, Phase 2, Phase 3, and Phase 4 windows. When created, waveforms are automatically displayed in content window number 1 for the correct type. To move a waveform to a different content window of the same type, use the SCPI commands shown in the following table. If the additional content window does not exist, it will automatically be created. There is no direct front-panel control for creating additional Waveform, Freq-Mag, Phase, and GrpDelay content windows. However, you can assign existing waveforms to new windows by selecting the commands listed in the table from within the front panel Interactive SCPI Command Tree. Refer to the FlexDCA Programmers Guide for information on the Interactive SCPI Command Tree.
The following table describes the various content windows and their availability.
| Content Window Title |
Availability in Instrument Mode |
Waveform Types | Number of Available Windows |
SCPI Command Used to Assign Waveform to Content Window |
Description | ||||
|---|---|---|---|---|---|---|---|---|---|
| Scope | Eye | TDR | Jitter | GUI | Remote | ||||
| Waveform | ♦ | ♦ | ♦ |
|
1 | 1 | None | This is the default window for most waveforms. Y-Axis: Volts or Watts (linear scale) X-Axis: seconds |
|
| Freq-Mag | ♦ | ♦ | ♦ |
|
1 | 4 | :FUNCtion<N>:CWINdow MAGNitude<N> | Y-Axis: dBV or dBm (logarithmic scale). X-Axis: seconds or Hertz. Use the GRAPh subsystem commands to autoscale, position, and scale waveforms. |
|
|
4 | 4 | :TRACe<N>:CWINdow MAGNitude<N> | ||||||
| GrpDelay | ♦ | ♦ | ♦ |
|
1 | 4 | :FUNCtion<N>:CWINdow GDELay<N> | Y-Axis: seconds X-Axis: Hertz. Use the GRAPh subsystem commands to autoscale, position, and scale waveforms. |
|
|
4 | 4 | :TRACe<N>:CWINdow GDELay<N> | ||||||
| Phase | ♦ | ♦ | ♦ |
|
1 | 4 | :FUNCtion<N>:CWINdow PHASe<N> | Y-Axis: phase (°) X-Axis: Hertz. Use the GRAPh subsystem commands to autoscale, position, and scale waveforms. |
|
|
4 | 4 | :TRACe<N>:CWINdow PHASe<N> | ||||||
| Time-Ohms | ♦ |
|
4 | 4 | :TRACe<N>:CWINdow TOHMs<N> | Y-Axis: Ohms X-Axis: Time. Use the GRAPh subsystem commands to autoscale, position, and scale waveforms and to specify the x-axis in time or distance (meters). |
|||
| Time-Volts | ♦ |
|
4 | 4 | :TRACe<N>:CWINdow TVOLts<N> | Y-Axis: Volts X-Axis: Time. Use the GRAPh subsystem commands to autoscale, position, and scale waveforms and to specify the x-axis in time or distance (meters). |
|||
| Time-% | ♦ |
|
4 | 4 | :TRACe<N>:CWINdow TPERcent<N> | Y-Axis: % X-Axis: Time. Use the GRAPh subsystem commands to autoscale, position, and scale waveforms and to specify the x-axis in time or distance (meters). |
|||
| Graphs | ♦ | Channel and Jitter Data Memory | — | — | None | Used for display of all Jitter Mode graphs. | |||