Trend Line Traces
Menu Path:
Trend Lines allow you to visualize a statistical trend line display for any of the supported Region Table metrics, accumulated over multiple acquisitions since the last Measurement Restart. Trend Lines can be displayed for All Regions or for a specified Ref Region.
For most metrics in the Region Table, there is a corresponding trend line that can be selected from the Trace > Data menu. Some metrics, like Region number, don’t participate in trending.
For example, you could select FM Slope Meas Time for Reference Region 1. If each acquisition contained three repetitions of Reference Region 1, three points would be added to the Ref Region 1 FM Frequency Modulation Slope Meas Time Trend Line per acquisition (and corresponding measurement update).
You can determine how many trend points are shown in a trend trace by changing the Display Length parameter in the Advanced tab. The actual number of points accumulated is determined by the Internal Buffer Length parameter. When the internal buffer becomes full, the most recent points are saved and the oldest points are discarded. The trend line will appear to scroll to the left as new points are added on the right side of the trace.
Trend lines are reset whenever the measurement is restarted. They are not reset when the measurement is paused, or trending is disabled during a running measurement, or trend removal settings are changed.
Trend lines accumulate most trace indicators that happen during the measurement (as long as the measurement completes and produces table data). Trace indicators come from the Pulse/Region table. The Sync Not Found indicator is not accumulated since the Region Table does not get calculated in this instance. The CAL? indicator is not accumulated while the measurement is running since the 89600 VSA Software only checks for CAL status once the measurement pauses. In addition, DATA? is not accumulated.
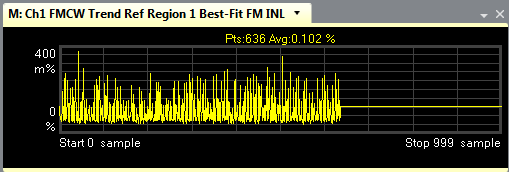
The following illustration shows an example of a Trend Line trace for Ref Region 1 - Best-Fit FM INL (%):
Trend removal
You have the option of normalizing the trend lines by removing the mean, slope, and/or 2nd order moment (parabolic fit). The coefficients of the fitted polynomial are stored in the trace’s header in the TrendPolyFitCoef key as an array double values. See Curve-fit Coefficients to learn how to use the coefficients to recreate the fitted polynomial. In this case, mean = a0, slope = a1, and 2nd order = a2.
When playing back a recording, the 89600 VSA Software is configured to use 90% overlap by default (). In this case, the same time data will be analyzed and accumulated in the trend lines multiple times. This will keep the trend line removal from removing the actual trend in the recording. To avoid this, make sure to set overlap to 0% when playing back from a recording.
Trend removal (especially the 2nd order calculation) can significantly reduce measurement speed. Also, large internal buffer sizes can also reduce measurement speed (the measurement will slow down as more points are accumulated). Note that trend removal is only performed for trend lines that are shown on the display (or for which you have acquired a MeasurementData instance through the API 1) Access Preamble Indicator, or 2) Application Programming Interface).
The annotation above the trend line trace shows the number of points in the trend buffer (also number of points used in calculating the histogram) as well as any mean/slope/2nd order that was removed from the data.
Ref to Trend/Histogram Enable for the associated Trend Line display control parameters.
See Also