Region Table
Menu Path:
The FMCW Region Table is a type of Matrix Table that includes all region-specific result metrics, measured over all valid synchronized FM Frequency Modulation region time samples detected within the user-defined Acquisition Length (sec) up to the user specified Maximum Region Count value.
All displayed metrics in the table (except for Region Index and Reference Region ID) are measured over the region-specific FM synchronized time samples, excluding the time samples identified by the Exclude During Analysis parameter. Each row in the table has a region number (sequential numbering in the order that they are found in the acquisition) and a reference region number (each Ref Region has an FM slope and a duration) which indicates where the region is in the repeating pattern.
Region Table metrics are listed under the following groupings:
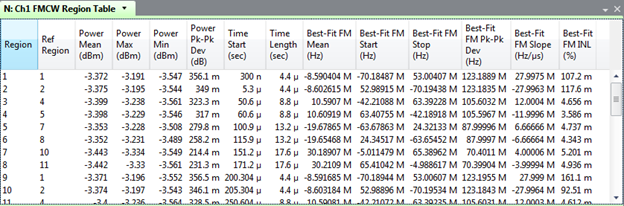
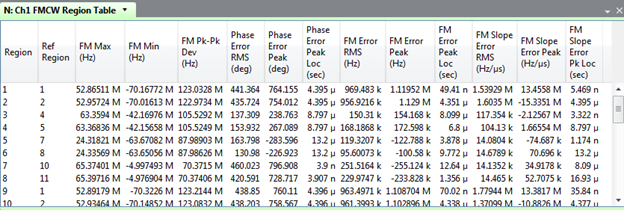
The following illustrations show an example of the Region Table configured to display Power, Time, and Best-Fit FM metrics, and another configured to display FM, Phase Error, FM Error and FM Slope Error metrics.
Region Metrics
- Region
- Region indicates the sequentially assigned region index within current measurement acquisition and corresponds with Selected Regions parameter selection values, plus region index annotation values reported within time traces when Highlight Selected Regions on Traces feature is enabled.
- Region index value 1 represents the first valid detected Analysis region within the Acquisition Length (s).
- Default visibility: ON (always visible)
- Region indicates the sequentially assigned region index within current measurement acquisition and corresponds with Selected Regions parameter selection values, plus region index annotation values reported within time traces when Highlight Selected Regions on Traces feature is enabled.
- Ref Region
- Reference Region value, indicates the assigned Ref Region identifier as defined within Manual Reference Description when Region Synchronization = Sync to Manual Reference or Triggered modes. When Region Synchronization = Automatic, the Ref Region identifier is automatically assigned based on the Reference Region Count value (which can either be an Automatic detected value or Manual specified value by user).
- Ref Region identifier range starts from value 1.
- Default visibility: ON (always visible)
- Reference Region value, indicates the assigned Ref Region identifier as defined within Manual Reference Description when Region Synchronization = Sync to Manual Reference or Triggered modes. When Region Synchronization = Automatic, the Ref Region identifier is automatically assigned based on the Reference Region Count value (which can either be an Automatic detected value or Manual specified value by user).
Sorting by metric
You can sort the table by any metric by left-clicking the metric name. Click again to toggle between ascending or descending order. Cancel sorting by right-clicking and selecting "Clear Sort".
You can highlight one row, then right-click and select Set Start Region to conveniently set the Starting Region.
See Also