Other Eye Diagram topics
PLTS constructs measurement-based eye diagrams (or patterns) by convolving the calculated time domain impulse response (generated from frequency domain measurement data) with a synthesized pattern of bit sequences. The following is a simplified block diagram of the eye diagram creation process.
With eye diagrams you can see signal quality with one display, you can diagnose problems, such as attenuation, noise, jitter, and dispersion that arise or characterize specific parts of the system. You can then view the measurement in the Time Domain mode to help isolate the source of the problem.
NRZ (non return to zero), also known as PAM2, is a Pulse Amplitude Modulated (PAM) signal with two amplitude levels. This signaling method transmits one bit of data for every bit, unit interval, or symbol interval.
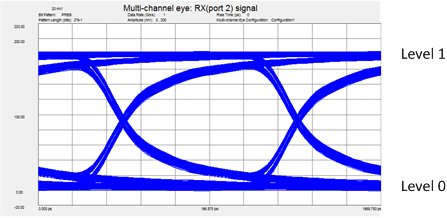
NRZ (PAM2) Signal
Instead of a 0 and 1 level as in NRZ, PAM4 has four amplitude levels (0, 1, 2, and 3). This signaling method transmits 2 bits of data for every symbol. As a result, PAM4 transmits twice as much data per unit time.
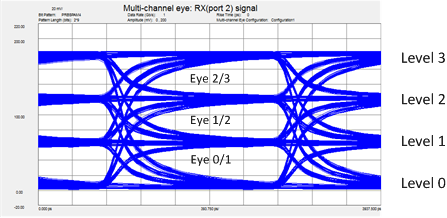
PAM4 Signal
The eye diagrams shown below identify key eye diagram definitions.
2-Level Eye Diagram (PAM2) |
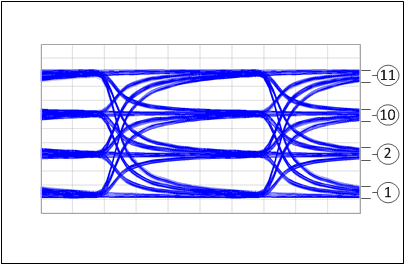
4-Level Eye Diagram (PAM4) |
1 |
Zero Level |
Zero Level is a measure of the mean value of the logical 0 of an eye diagram. |
2 |
One Level |
One Level is a measure of the mean value of the logical 1 of an eye diagram. |
3 |
Rise Time |
Rise time is a measure of the transition time of the data from the 10% level to the 90% level on the upward slope of an eye diagram. |
4 |
Fall Time |
Fall time is a measure of the transition time of the data from the 90% level to the 10% level on the downward slope of an eye diagram. |
5 |
Eye Height |
Eye height is a measure of the vertical opening of an eye diagram. An ideal eye opening would be measured from the one level to the zero level. However, noise on the eye will cause the eye to close. The eye height measurement determines eye closure due to noise.
|
6 |
Eye Width |
Eye width is a measure of the horizontal opening of an eye diagram. Ideally, the eye width would be measured between the crossing points of the eye. However, jitter may appear on the waveform and influence the eye opening. A preference setting determines exactly how this measurement is made. Learn more. |
7 |
Deterministic Jitter |
Deterministic jitter is the deviation of a transition from its ideal time caused by reflections relative to other transitions. |
8 |
Eye Amplitude |
Eye amplitude is the difference between the logic 1 level and the logic 0 level histogram mean values of an eye diagram. |
9 |
Bit Rate |
Bit rate (data rate) is the inverse of bit period (1 / bit period). The bit period is a measure of the horizontal opening of an eye diagram at the crossing points of the eye. |
10 |
Two-Level |
Two-Level is a measure of the mean value of the logical 2 of a PAM4 eye diagram. |
11 |
Three-Level |
Three-Level is a measure of the mean value of the logical 3 of a PAM4 eye diagram. |
Changing the Time Domain Window setting has the following effect on Eye Diagrams:
Click Tools, then Time Domain Settings
Learn more about Time Domain Windowing
During an Eye Diagram conversion, one of the following may appear in the corner of the display. Learn more about these icons.
Icon |
Icon Name |
|---|---|
|
Resampled Data - This icon indicates that only the harmonically-related data points were used to generate time domain data. |
|
Interpolated Data - This icon indicates interpolation is performed to calculate the harmonically-related points that were not measured. Any measurements that were performed at harmonically-related points are left unchanged. The interpolated data is used, along with the measured harmonically-related data, to perform the Inverse Fast Fourier Transform (IFFT) for the calculated time domain data. |
|
Bad Data - This icon indicates there are less than 10 harmonically-related data points in the measured data. In this case, all of the non harmonically-related data is used to perform the Inverse Fast Fourier Transform (IFFT) to calculate time domain data. This may result in inaccurate time domain data. |
Learn how to open Eye Diagram plot windows.
With Eye Diagrams, only transmission paths are displayed; no reflection paths are displayed.
1. On the Parameter Format Selection pane:
Click Parameter, then select one or more parameters to view.
Click Equation to Synthesize Eye Diagram from Equations.
2. The Choose Bit Pattern dialog box may be displayed. The dialog box is NOT displayed if the bit pattern has already been selected for the data.
The selected Eye Diagrams are plotted.
3. To view a single plot, double-click on the plot. Double-click again to view all plots.
Note: Beginning with PLTS 4.5, the vertical axis of Eye Diagrams can be scaled using the scaling toolbar. Reset the vertical scale by right-clicking the Eye diagram, then click Reset.
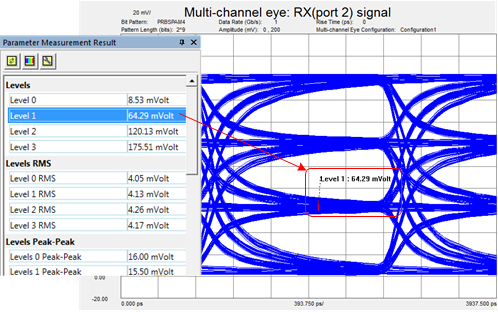
4. When a Multi-channel Eye Diagram is active, the buttons (red circle in above image) are displayed.
The left button, selected by default, displays an Eye Diagram.
The right button, displays the simulated, enhanced bit pattern.
To add markers to an Eye Diagram, right-click on the plot, then click Insert.
Each eye diagram marker has two components:
The X-axis component is displayed as a line that extends from the top to the bottom of the eye diagram.
The Y-axis component is displayed as a line that extends from the left side to the right side of the eye diagram.
![]()
These markers can be moved ONLY from Marker Bar slider control.
To see Eye Diagram measurement results, statistics, and the following Eye Diagram options:
On the Parameter toolbar click the Parameter Meas Tab
The following buttons line the top of the Parameter Meas tab (shown in red circle below - from left to right):
1. Hide Histogram and re-measure Eye Parameters - Click to refresh the results.
2. Draw Eye Color Grades - Click to show the densest patterns as red, then yellow, then light green, then dark blue (as least dense).
3 through 8 (not available for PAM4 signal) Show histograms and dimensions of how the measurements are made:
Amplitude, Height, Width, Jitter, Rise Time, Fall Time.
9. Launch the Configure Eye Measurements dialog.
|
Eye Amplitude plotted on selected eye diagram. |
Name |
Definition |
Eye Level Zero (mV) |
Mean value of logical zeros |
Eye Level One (mV) |
Mean value of logical ones |
Eye Level Mean (mV) |
Mean value of logical ones and zeros |
Eye Amplitude (mV) |
Difference between logical 1 and logical 0 histogram mean values. |
Eye Height (mV) |
Vertical opening of the eye diagram |
Eye Height (dB) |
Vertical opening of the eye diagram |
Eye Width |
Horizontal opening of the eye diagram |
Eye Opening Factor |
Ratio of eye height to eye amplitude |
Eye Signal to Noise |
Ratio of the signal difference in logical 1 to logical 0 relative to the noise present at both levels. |
Eye Duty Cycle Distortion |
Time separation between the rising edge and falling edge at the 50% (middle) threshold of the eye diagram. |
Eye Duty Cycle Distortion (in %) |
Percent of duty cycle distortion |
Eye Rise Time (20-80) |
Mean transition time of the data on the upward slope (rising edge). |
Eye Fall Time (80-20) |
Mean transition time of the data on the downward slope (falling edge). |
Eye Jitter (PP) |
Time variances between the rising and falling edges. These edges affect the crossing point of the eye. PP= full width of the histogram at the eye diagram crossing point. |
Eye Jitter (RMS) |
Time variances between the rising and falling edges. These edges affect the crossing point of the eye. RMS= standard deviation of the histogram at the eye diagram crossing point. |
|
Click on a parameter to view the result on the plot |
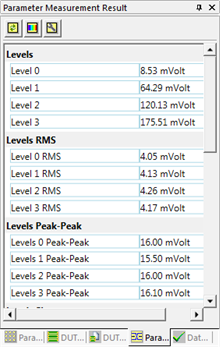
Name |
Definition |
Levels |
|
Level 0 |
Mean value of logical zeros |
Level 1 |
Mean value of logical ones |
Level 2 |
Mean value of logical twos |
Level 3 |
Mean value of logical threes |
Levels RMS |
|
Level 0 RMS |
Jitter amplitude in RMS of level zeros |
Level 1 RMS |
Jitter amplitude in RMS of level ones |
Level 2 RMS |
Jitter amplitude in RMS of level twos |
Level 3 RMS |
Jitter amplitude in RMS of level threes |
Levels Peak-Peak |
|
Level 0 Peak-Peak |
Peak-peak jitter amplitude of level zeros |
Level 1 Peak-Peak |
Peak-peak jitter amplitude of level ones |
Level 2 Peak-Peak |
Peak-peak jitter amplitude of level twos |
Level 3 Peak-Peak |
Peak-peak jitter amplitude of level threes |
Levels Skew |
|
Level 0 Skew |
Skew time of level zeros |
Level 1 Skew |
Skew time of level ones |
Level 2 Skew |
Skew time of level twos |
Level 3 Skew |
Skew time of level threes |
Eye Levels |
|
Eye 0/1 Level |
Skew time between level zeros and level ones |
Eye 1/2 Level |
Skew time between level ones and level twos |
Eye 2/3 Level |
Skew time between level twos and level threes |
Eye Skews |
|
Eye 0/1 Skew |
Eye skew time between level zeros and level ones |
Eye 1/2 Skew |
Eye skew time between level ones and level twos |
Eye 2/3 Skew |
Eye skew time between level twos and level threes |
Eye Heights |
|
Eye 0/1 Height |
Vertical opening of level zeros and level ones |
Eye 1/2 Height |
Vertical opening of level ones and level twos |
Eye 2/3 Height |
Vertical opening of level twos and level threes |
Eye Widths |
|
Eye 0/1 Width |
Horizontal opening of level zeros and level ones |
Eye 1/2 Width |
Horizontal opening of level ones and level twos |
Eye 2/3 Width |
Horizontal opening of level twos and level threes |
Linearity |
|
Linearity |
Linearity RLM (Ratio Level Mismatch) between all four amplitude levels (0, 1, 2, 3) of a PAM4 eye diagram. Linearity is a measure of the variance in amplitude separation (distribution) between the different PAM4 levels. |
RN 0 RMS |
Random noise level of level zeros |
RN 1 RMS |
Random noise level of level ones |
RN 2 RMS |
Random noise level of level twos |
RN 3 RMS |
Random noise level of level threes |
Jitter |
|
TJ 0 RMS |
Total jitter of level zeros |
TJ 1 RMS |
Total jitter of level ones |
TJ 2 RMS |
Total jitter of level twos |
Click ![]() on the Parameter
Measurement Results tab.
on the Parameter
Measurement Results tab.
Configure EYE Measurements dialog box help |
|
2-Level Signal (PAM2)
In the Sample Window Boundaries, you can increase or decrease the size of three measurement areas. This will change the results of the corresponding measurements. Sample Window Boundaries
Eye Diagram User Preferences tabThis tab contains shortcuts to set the following Eye Diagram User Preferences. These preferences also appear in the main User Preferences dialog.
Disable the use of the 3 sigma buffers for eye measurement calculations. Check to use the following equation:
Clear (uncheck) to use the following equation:
Do not update plot when calculating eye data When checked, do NOT show progress dialog and do NOT draw eye until all data calculated. When plotting long bit pattern eye diagrams, this setting can save a LOT of time. Clear to show progress and draw eye diagram as data is being calculated. Eye Mask - Use measured amplitude values for eye mask scaling. This preference applies ONLY for eye masks defined in ratios.
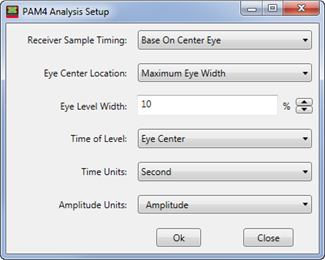
4-Level Signal (PAM4)
Receiver Sample Timing - This setting configures the timing for sampling the data. Use this setting to match the timing method used by a receiver. For signals with skewed eyes, measurements results will vary depending on this setting. Base On Center Eye - Sampling timing is based on the location of the center eye (eye 1/2). This is the default setting. Independent Per Eye - Sampling timing is independently based on the location of each of the three eyes. Eye Center Location - This setting selects the basis for determining the location of an eye's center on the waveform. Maximum Eye Width - The eye's center is located at the eye's maximum width midway between the eye's inside left and right edges. This is the default setting. Maximum Eye Height - The eye's center is located at the eye's maximum height midway between the eye's inside top and bottom edges. Eye Level Width - This setting defines the timespan over which an eye's amplitude level is measured. The timespan is specified as a percentage (from 1% to 25%) of the symbol period. The default setting is 10%. Time of Level - This setting specifies the method used to locate the time at which to measure an eye's level. Eye Center - The time of a level is the average of the centers of the adjacent eyes. This is the default setting. Minimum RMS - The time is located within the eye's level width at the minimum level thickness (RMS values). Time Units - This setting specifies the time units. Second - Width and skew measurements are reported in seconds. This is the default setting. Unit Interval - Width and skew measurements are reported in unit intervals. Amplitude Units - This setting specifies amplitude units. Amplitude - Level and height measurements are reported in the current amplitude units: volts or Watts. This is the default setting. Percent - Level and height measurements are reported in percent.
|
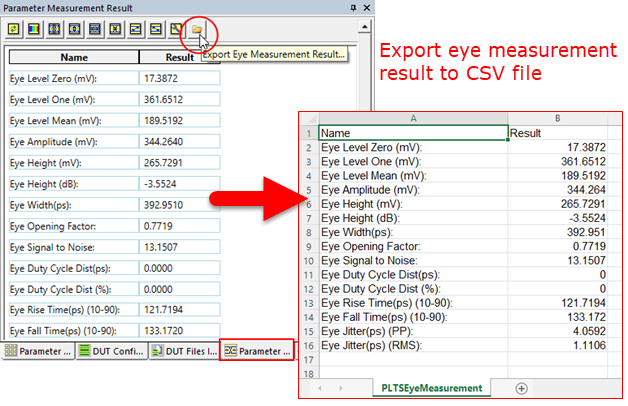
Draw or select the eye diagram.
Select the Parameter Measurement Result panel.
Click the Export Eye Measurement Result button to create a *.csv file.