SNDR
 Assuming ISI jitter and noise is 100% compensable by equalizers and is of no consequence to system performance, you can project a system's performance (when equalizers are used) by determining the ratio between the signal from linear fit pulse response and distortion-plus-noise. This ratio is called Signal to Noise and Distortion Ratio (SNDR). Some technology standard documents publish SNDR specifications.
The SNDR measurement is arrived at by performing linear fit pulse response and linear fit error (matrix) math functions on the input waveform and then by making calculations based on the results.
Signal to Noise and Distortion Ratio (SNDR) is defined by the equation:

Where:
- Pmax is a measure of the energy in p(k), which is the linear fit pulse response.
- σe is Sigma-e, the standard deviation of e(k), which is the linear fit error. The linear fit error is the difference between the input signal and the linear fit Pulse Corrected waveform; it represents essentially the distortion from a linear response.
- σn is Sigma-n, an averaged measurement of the RMS deviation from the mean voltage noise (σ) at all PAM levels. σn represents essentially the crosstalk and all other external noise.
The SNDR measurements include: Sigma-n, Sigma-n Per Level, Sigma-e, P-max, and SNDR.
You can also view the math waveforms created during the measurement process: the pattern average, the Linear Fit Pulse Response, p(k), the pulse corrected pattern average, and the pulse corrected error, e(k).
To set up and enable SNDR measurements and waveforms:
-
Specify the analog input channel source signal type (see Signal Type Setup).
When the signal eye is closed, you must specify the pattern. When the eye is open and the pattern is relatively short, automatic pattern detection works fine.
-
Set up the appropriate clock recovery options for the input source signal. See Clock Recovery.
-
Select the measurement toolbar's Data tab.
-
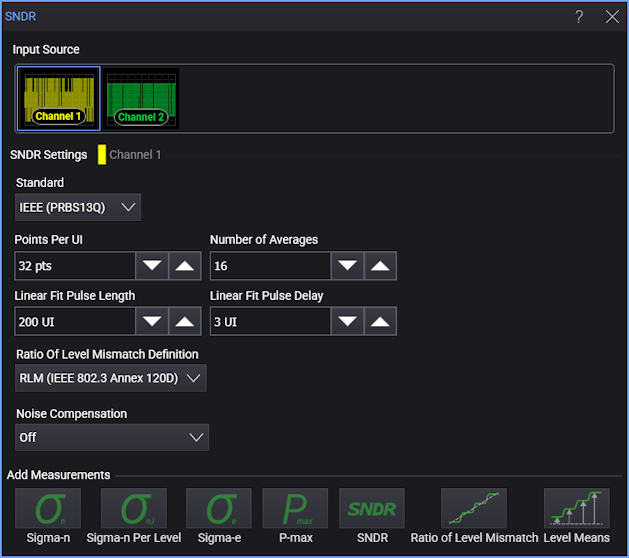
Select the SNDR Setup button. This opens the SNDR dialog box:
-
Select the Input Source waveform on which to make measurement(s).
-
Select the technology Standard you want to use for SNDR measurement definitions:
SNDR Standards Signal Type Standard Notes NRZ ASA SG1-3 (Speed Grade SG1, SG2, or SG3) — This selection uses the technique outlined in the ASA (Automotive SerDes Alliance) Transceiver specification version 1.1 section 4.4.1.1.2. NRZ, PAM3, PAM4 Automatic Based on the input pattern, the algorithm looks for ideal points that can be used to calculate Sigma-n. Any pattern that contains every signal level is supported. Then, the Sigma-e and P-max measurements are calculated using the same method as the IEEE (PRBS13Q) standard (without requiring the PRBS13Q pattern).
When the Automatic standard is selected, you can save the automatically calculated Sigma-n locations to a standard definition file.
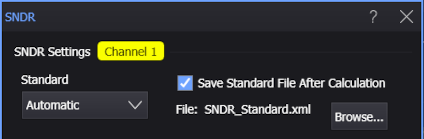
The saved file includes comments that indicate valid values for each element and their effects.
The saved standard definition file can be used again with the File option.
PAM4 PCIe This selection, available with PAM4 signal types, uses a process described in the PCIe 6.0 standard. See SNDR with the PCIe Gen6 Standard and Determining Sigma-n According to the PCIe Gen6 Standard. PAM4 IEEE 802.3 dj This is the same as the IEEE (PRBS13Q) option except it uses PCIe sum of squares of dual pulse fit vectors for Effective P-max instead of just maximum of LFPR. PAM4 IEEE (PRBS13Q) This selection uses the technique outlined in the IEEE 802.3 specification clause 120D.3.1.6. The algorithm looks for six or more consecutive identical symbols and places the voltage measurement at the center of the 3rd UI. The variance of all those measurements is taken and then the standard deviations are averaged to get σn.
The PRBS13Q pattern provides runs of at least six consecutive identical PAM4 symbols at each of the PAM4 levels.PAM4 ASA SG4, 5 (Speed Grade SG4 or SG5) — This selection uses the technique outlined in the ASA (Automotive SerDes Alliance) Transceiver specification version 1.1 section 4.4.1.1.2. PAM3 USB4 Gen 4 This selection uses the technique outlined in the USB4 specification version 2.0 section 3.2.3.4. NRZ, PAM3, PAM4 File This selection allows for custom measurement parameters loaded from a file.
The format of this file is proprietary. For help developing custom files, contact Keysight Technical Support and ask for an Application Engineer. -
Specify the parameters used for the linear fit math functions:
- Points Per UI — The number of sample points per UI (symbol) to use in the computation.
- Number of Averages — The number of patterns to average in the linear fit computation.
- Linear Fit Pulse Length — This parameter is used in the filter to compute the linear fit pulse response. It is the length of the pulse fit, expressed as the number of unit intervals (UIs). It is sometimes denoted using Np.
- Linear Fit Pulse Delay — This parameter is used in the filter to compute the linear fit pulse response. It is also a number of unit intervals (UIs). It is sometimes denoted using Dp.
-
Ratio of Level Mismatch Definition — For PAM3 and PAM4 signal types, this parameter specifies the RLM measurement calculation algorithm to use.
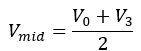
This PAM4 symbol levels picture identifies the voltage levels used in the following equations.
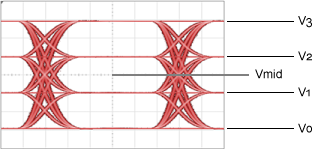
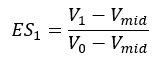
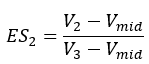
RLM Standards Parameter Available with signal types Description RLM (IEEE 802.3 Annex 120D) PAM4 The linearity is defined as a function of the mean signal level transmitted for each PAM4 symbol level. In the following equations, the term ES stands for the Effective Symbol Level.

RLM (IEEE 802.3 Clause 94) PAM4, PAM3 For PAM4:
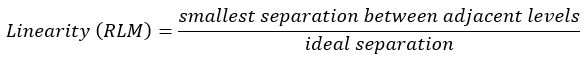
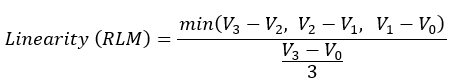
For PAM3, the equation is the same except the V3 is changed to V2 and the division is by 2 instead of 3.
Eye Linearity (CEI 4.0) PAM4, PAM3 Eye linearity is the ratio of minimum eye amplitudes (in Volts) to maximum eye amplitudes (in Volts). For PAM4:
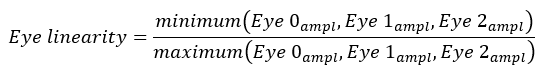
For PAM3, the equation is the same except the Eye 2 terms are omitted.
Technology standard test documents typically tell you the values expected to be used for these parameters.
-
Specify any Noise Compensation you want to make in the measurements. You can select:
- Off
- Remove Scope Noise — Removes the oscilloscope's calibrated random noise. Click Calibrate Noise... to open the Calibrate Scope Noise dialog box where you can run the automatic oscilloscope random jitter/noise calibration.
- Remove Custom Noise Value — Use the related fields to enter the amount of random noise to remove from each symbol level.
-
Click the Add Measurements buttons to add measurements:


Sigma-n Sigma-n Per Level Sigma-e P-max SNDR 

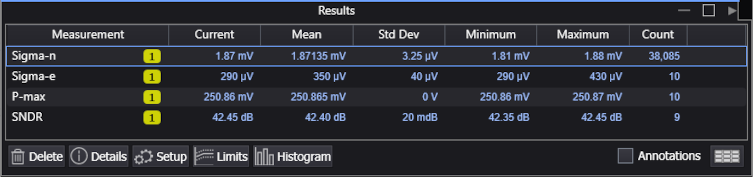
Ratio of Level Mismatch (PAM4, PAM3) Level Means When these measurements are added, their measured values appear in the measurement Results area.
-
To display pattern average, Linear Fit Pulse Response, pulse corrected pattern average, or pulse corrected error SNDR function waveforms (and specify their scaling), see SNDR Operator.
Questionable SNDR Measurement Results
A question mark "?" can appear for Sigma-n and SNDR measurement results when oscilloscope random noise (see the previous Noise Compensation description) on one of the signal levels is greater than the measured Sigma-n for that level. In this case, zero Sigma-n is contributed for the level; however, other levels can have Sigma-n values greater than the oscilloscope random noise and can contribute valid results to the Sigma-n measurement (averaged across all levels).
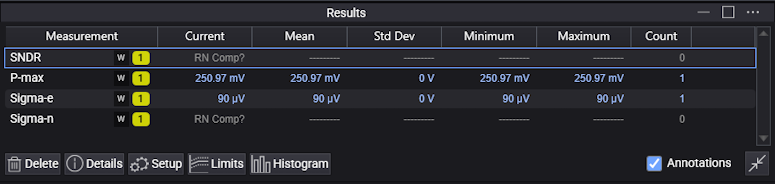
Because Sigma-n feeds into the SNDR calculation, a question mark for the Sigma-n measurement also means a question mark for the SNDR measurement.