28Channel Scanner (Option 312)
In this Chapter
:See Also
Chapter 31, “System Settings.” (Changing display colors) |
Channel Scanner enables you to do the following:
Figure 28-1 Display Example: Measure 5 Channels Spaced 2 MHz Apart
This section briefly reviews the steps in setting up a channel scan measurement. If you are not familiar with this process or would like more information, refer to “How to Define a Channel and Use Channel Scanner”.
1.Define some channels (refer to “How to Define a Channel and Use Channel Scanner”).
a.Select a Scan Mode—choose:
—Range Specify total channels, channel spacing or
—Custom List Specify a list of channels from an editor or
—EMF Custom List Specify a list of items related to EMF measurement from an editor
b.Then modify channels based on the selected scan mode
2.Select Display Type—choose:
—Bar ChartV or
—Bar ChartH or
—Channel Pow or
—Table or
—Strip Chart or
—Then More and
—Chart Overlay or
—Scan&Listen
3.Modify scale and specify color bar coding—Modify the scale and assign colors to low and high power channels (bars):
Press Scale/Amptd
Then one of the following:
—Red Limit to set the power level and color scale for high power channels.
—Blue Limit to set the power level and color scale for low power channels.
—Others: Scale, Ref Level, RF Atten, etcetera as desired.
4.In the EMF Custom List scan mode, to adjust the Relative Mode setting and select specify column for display in the result table: IMPORTANT! The EMF softkey menu is only activated when the scan mode is in the EMF Custom List.
a.Press Trace 6 > EMF, refer to Figure 28-6 on page 732
b.Then one of the following:
| When Relative Mode is enabled, the first row of the table is highlighted in a different color from the other rows. If the table includes a column ID, it will be labeled ’1-ref’. Expected Use Case: Channel 1 contains the entire band, which should be evaluated by each of the subsequent channels (2 through n), where n is the total number of channels. Example: Channel 1: 50MHz - 100MHz (Reference Band when Relative Mode is enabled. Channel 2: 50MHz - 75MHz Channel 3: 75MHz - 100MHz |
—Relative Mode (Default == OFF) ON to enable Relative Mode.
—Relative Unit Select the unit of measurement for ratio type results.
—Auto (Default) - Firmware will decide [%] or [dB] based on the current Amplitude Unit setting, Scale /Amptd6 > More > Unit.
—% - Ratio type results in unit %.
—dB - Ratio type results in unit dB. To view relevant ratio type results, ensure that both Relative Mode and Limit Lines are enable.

—Column Display Select a custom column to display in the table when the Display Type is set to "Table".
—Summary - Display all channels across the following columns: Service, Band, P Live, P Min, P Avg, P Max, PMin/PLim, PAvg/PLim, and PMax/PLim in the table when Relative Mode is disabled, where P is Channel Power. Refer to Figure 28-6. When Relative Mode is enabled, the Column Display automatically switches to Exposure Ratio.
—P/F - Pass (P) or Fail (F) if Limit Tests are enabled for the channel or ’-’ if Limit Tests are not enabled. Refer to “Disable Limit Test in Channel Scanner mode,” on page 835
—IBW – Integration bandwidth (IBW) of a channel relative to the first (reference) channel in Relative Units (% or dB) when Relative Mode is enabled. When Relative Mode is disabled, the IBW value is displayed in Hz.
—CHP – Channel power (CHP) of a channel relative to the first (reference) channel in Relative Units (% or dB) when Relative Mode is enabled. When Relative Mode is disabled, the CHP value is displayed in amplitude units (e.g., V/m).
—PMax - The maximum power measured since the most recent restart. When Relative Mode is enabled, the PMax value displayed in Relative Units (% or dB). When Relative Mode is disabled, it is displayed in measured units.
—PMin - The minimum power measured since the most recent restart. When Relative Mode is enabled, the PMin value displayed in Relative Units (% or dB). When Relative Mode is disabled, it is displayed in measured units.
—Exposure Ratio - The table view is similar to the Summary table view, but with Relative Mode ON, which calculate the exposure ratio for each Channel Power reading. When Relative Mode is disabled, the Column Display automatically switches to Summary.
5.Enable Data Logging Settings: Press Measure 1 or Trace 6 > Data Logging to view the Data Logging softkeys and set the Record Settings, Record Save/Recall, and More > Indoor Map Data Logging or Signal Locate.
—Record (Outdoor Logging) or
—Play (If you have previously stored data recordings.) or
—View
a.To set the Record Settings (Outdoor Mapping only)—choose:
—Meas Interval
—Interval Type Time or Distance
—Time Interval or
—Distance Interval
—Then Back
b.Then press Record Save/Recall
—Then File Folder Default System
—Default – Sets the default User Folder path:
——List files (*.csv and *.kml) are save-recalled to: "[CurrentDevice]:\RecordPlayback\CS\"
——Data Log-Play files are save-recalled to: "[CurrentDevice]:\RecordPlayback\CS\"
Or
—System – Sets the User Folder to the user defined system folder path/name:
——List files are save to-from "CurrentDevice\<UserSelectedFolder>\"
——Data Log-Play files are save-recalled to: "CurrentDevice\<UserSelectedFolder>\"
Refer to “File Management” on page 913.
—Then File Type
— KML (Default) or
—CSV
—Then Save Log File.
or
—Then Recall Log File.
—Auto Save) (Default == OFF)
—Then Back
c.Optional: Press Indoor Map Data Logging then
— Record Indoor Data or Recall Indoor Log File. Learn more, refer to Chapter 16 Mapping and “Option 352 Indoor Maps Setup Procedure” on page 515 ans “Setting up Data Logging” on page 527.
d.Optional: Press Signal Locate – Opens a softkey menu of directional finding (DF) bearing softkeys. Learn more, refer to Chapter 16 Mapping and “How to Add Directional Finding (DF) Bearing” on page 537.
6.Press Back to return to previous menu.
7. Outdoor Mapping only: If recording, then:
—View Map OFF ON To enable/disable the current map view (Default == latitude/longitude == 0.00/00. Need GPS to view current location (Default == OFF).
—Pause Resume Temporarily halts recording until pressed again. The incoming trace continues to sweep. Press again to continue recording.
—Stop Immediately stops recording and a “Save the Log File” menu opens to rename and save your data log file.
—(Press Record to begin a new recording.)
—Then Maps To enable map view and related features (e.g., Data Selection, Red/Blue Limits, Labels & Icons, Zoom).
—Data Selection Opens a softkey menu to set the active data channel, sort type, and sort order.
Learn more, refer to Chapter 16 Mapping and “Setting up Data Logging” on page 527. See also, Chapter 33, “File Management.”
—Red/Blue Limits Opens a softkey menu to assign power values to the red (high power limits) and blue (low power limits) heat map display limits (Defaults: Red Limit == –20 dBm, Blue limit == –90 dBm).
—Labels & Icons Opens a softkey menu to enable/disable map data point labels and icon types.
Labels | Enables/Disables map data point labels. When enabled, a label is displayed for every map data point (e.g., “Data 1”). When disabled, labels are not displayed for the map data points. |
Icons | Sets the type of icon that is used to display a map’s data points (Default == Flag). |
— Save Image (PNG) Saves the current displayed map to a *.png file (default filename is “MapImageFile”).
| Data Log-Play files are saved to: —If File Folder is set to Default then Data Log-Play files are save-recalled to: "[CurrentDevice]\RecordPlayback\CS" —If File Folders are set to System, then Data Log-Play files are save-recalled to: "CurrentDevice\<UserSelectedFolder>\ |
8.Outdoor Mapping: Export KML file into 3rd party mapping software (i.e., Google or Google Earth)
Learn more, refer to Chapter 16 Mapping and “Setting up Data Logging” on page 527. See also, Chapter 33, “File Management.”
How to Define a Channel and Use Channel Scanner
Channel definitions consist of the following:
—Each channel is defined by CF and Integration BW.
—Frequency span is set automatically to 1.5 x Integration BW
—Power is measured over the Integration BW
Using Channel Scanner, refer to:
—“Step 1A: Scan Mode – Range Channel Defined” on page 727 or
—“Step 1B: Scan Mode – Custom List Channel Defined” on page 728 or
—“Step 1C: Scan Mode – EMF Custom List Channel Defined” on page 729
Then:
—“Step 2. Select Display Type” on page 733
—“Step 3. Modify Scale and the Display Color Bar Settings” on page 739
—“Step 4. Sort and Search softkey menu” on page 740
—“Step 5. Enable Data Logging and Play Results” on page 741
—“Step 6. Save the Log Results:” on page 745
Figure 28-2 Channel Definition
Step 1A: Scan Mode – Range Channel Defined
1.Define some channels: Press Measure 1 > Scan Mode > Range
2.Press Edit Range and modify table items:
—Total Channels
—Search Count
—Start Channel CF
—CF Step Size
Figure 28-3 Range Table Settings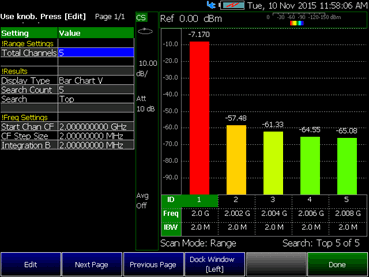
3.Press Done
Step 1B: Scan Mode – Custom List Channel Defined
1.Define some channels: Press Measure 1 > Scan Mode > Custom List
2.Press Edit Custom List and modify table items:
—Add table rows
—Then for each row:
—Edit Center Frequency (CF)
—Edit Integration BW (IBW)
| Integration BW (IBW) is coupled to the Frequency Span setting. Frequency Span is 50% wider than the IBW (e.g., if the IBW value is 1 MHz, then the Frequency Span value is 1.5 MHz). |
Figure 28-4 Custom List Table Settings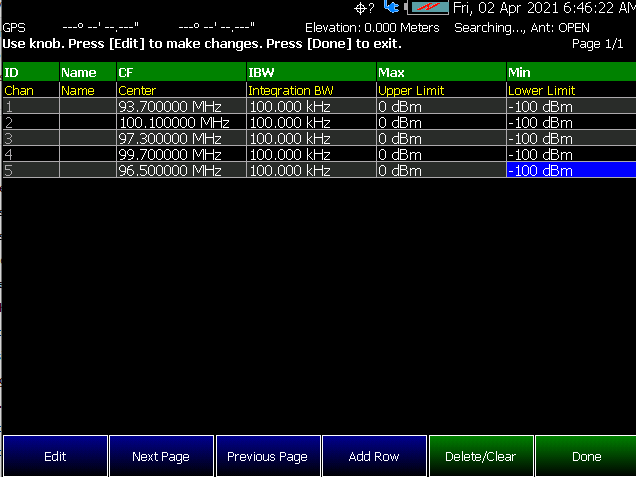
3.Press Done
4.Press Save Recall List > Save List to save a custom list. See also “How to use the FieldFox labeler ” on page 916.
5.Press Done
| Press Recall List to bring back a previously stored custom list. |
Step 1C: Scan Mode – EMF Custom List Channel Defined
1.Define some channels: Press Measure 1 > Scan Mode > EMF Custom List
2.Press Edit EMF Custom List and modify table items:
a.Press Add Row to add table rows
b.Then for each row
—Edit Start Frequency (StartF)
—Edit Stop Frequency (StopF)
—Edit Resolution Bandwidth (RBW)
—Edit Upper Limit (Max)
Figure 28-5 EMF Custom List Table Settings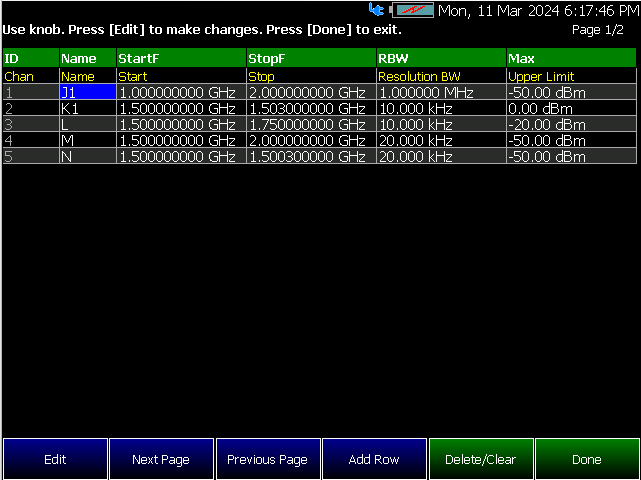
3.Press Done
4.Press Save Recall List > Save List to save a EMF Custom List. See also “How to use the FieldFox labeler ” on page 916.
5.Press Done
| A template EMF Custom List file named EMF_Channel_List_Template.csv is located in the same directory used for storing user-defined channel lists "ChannelScanner\ChannelLists". This template can be utilized to verify the syntax used for populating EMF metadata information, such as antenna serial number, model, etc. These details will generate annotations on the table display and will also be logged when performing a recording. |
To Export EMF Custom List to Limit Line File (EMF Custom List Only)
1.Press Measure 1 > Save Recall List > Export List To Limit Line File to Export EMF Custom List to Limit Line File. See also “How to use the FieldFox labeler ” on page 916.
2.Press Done. The file is saved to the same default location as all limit files
3.To utilize this Limit Line file, press Limit 8 >Recall Limits.
| The Export List function generates a CSV file wherein each data point corresponds to the Center Frequency and the current Upper limit and current unit of each channel. |
| IMPORTANT! The EMF softkey menu is only activated when the scan mode is in the EMF Custom List. |
Using EMF softkey menu
1.Press Trace 6 > EMF to EMF menu. Refer to Figure 28-6 on page 732. Then
2.Press Column Display and select a custom column from the following to display in the table when the Display Type is set to "Table":
—Summary - Display all channels across the following columns: Service, Band, P Live, P Min, P Avg, P Max, PMin/PLim, PAvg/PLim, and PMax/PLim in the table with Relative Mode disabled, where P is Channel Power. When Relative Mode is enabled, the Column Display automatically switches to Exposure Ratio.
—P/F – displays P (Pass) or F (Fail) if Limit Tests are enabled for the channel, or ’-’ if Limit Tests are not enabled. Refer to “Disable Limit Test in Channel Scanner mode,” on page 835
—IBW – displays the integration bandwidth (IBW) of a channel relative to the first (reference) channel in Relative Units (% or dB) when Relative Mode is enabled.
—CHP – displays the channel power (CHP) of a channel relative to the first (reference) channel in Relative Units (% or dB) when Relative Mode is enabled.
—PMax – display the maximum power measured since the most recent restart. When Relative Mode is enabled, the PMax value displayed in Relative Units (% or dB).
—PMin – display the minimum power measured since the most recent restart. When Relative Mode is enabled, the PMin value displayed in Relative Units (% or dB).
—Exposure Ratio - The table view is similar to the Summary table view, but with Relative Mode enabled, which calculate the exposure ratio for each Channel Power reading. When Relative Mode is disabled, the Column Display automatically switches to Summary. When Relative Mode is disabled, the result table displays the selected IBW, CHP, PMax, or PMin values in columns labeled BW (Hz), P Live (V/m), P Max or P Min with the corresponding measured units. When Relative Mode is enabled, the result table displays the selected IBW, CHP, PMax or PMin values in columns labeled BW, P/Ref, P Max, or P Min using Relative Units (% or dB). These values represent the relative measurement compared to the first channel, which is labeled as the reference channel (ID column labeled ’1-ref’).
3.Press Relative Mode and choose
—ON to enable Relative Mode (Default == OFF). When Relative Mode is enabled, the EMF Custom List Editor labels the first row in the ID column as ’1-ref’.
4.Relative Unit Changes the unit of ratio type results. To view relevant ratio results, ensure that both Relative Mode and Limit Lines are enable.
—Auto (Default) - Firmware will decide [%] or [dB] based on the current Amplitude Unit setting, Scale /Amptd6 > More > Unit.
—% - Ratio type results in unit %.
—dB - Ratio type results in unit dB. To view relevant ratio type results, ensure that both Relative Mode and Limit Lines are enable.
Learn more, refer to “Creating and Importing *.csv Limit Line Files” on page 841.
Figure 28-6 EMF Custom List - EMF Menu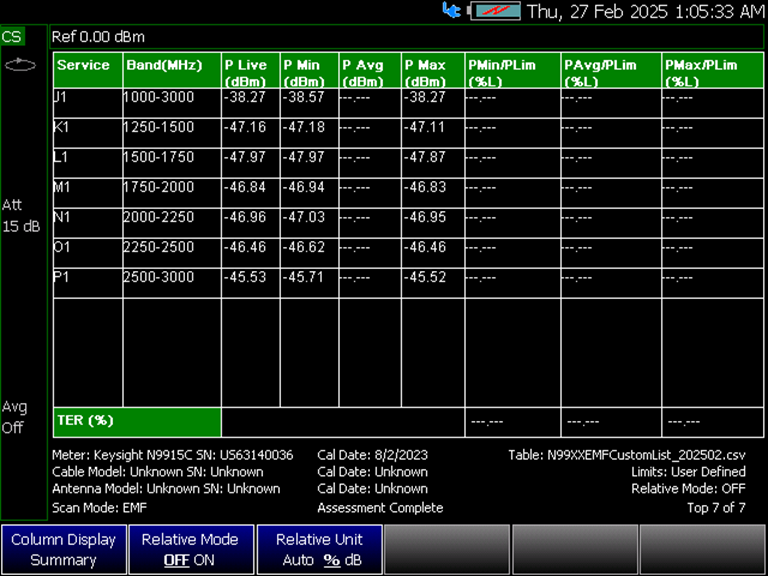
Select one of the following display orientations:
—Select Measure 1 > Display Type—choose:
—Bar ChartV or
—Bar ChartH or
—Channel Pow or
—Table or
—Strip Chart or
—Chart Overlay or
—Scan&Listen
| In the EMF Custom List scan mode, when limit lines are configured, users will notice a red line representing the limit on a channel in both the Vertical and Horizontal Bar Charts. If the channel passes the limit test, the bar will show "P". If the channel fails the limit test, it will display "F". If the limit test for a channel is disabled, neither "P" nor "F" will appear on the bar, and there will be no red limit line displayed for that channel. Refer to Figure 28-8 and Figure 28-10 |
Figure 28-7 Bar Chart Vertical Display Type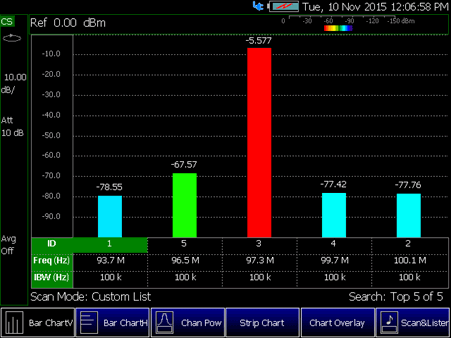
Figure 28-8 Bar Chart Vertical Display Type - EMF Custom List with Limit Line Configured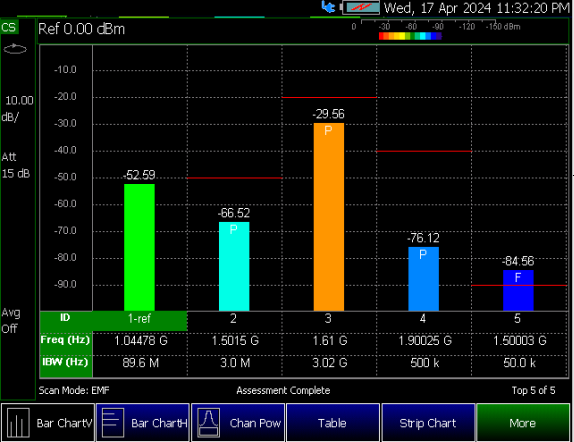
Figure 28-9 Bar Chart Horizontal Display Type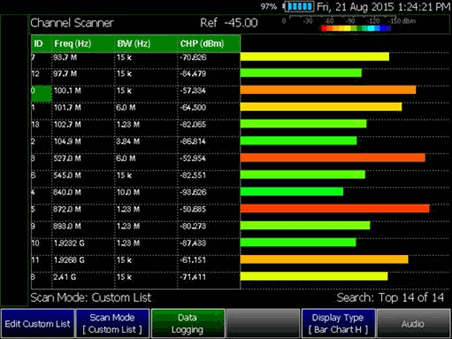
Figure 28-10 Bar Chart Horizontal Display Type - EMF Custom List with Limit Line Configured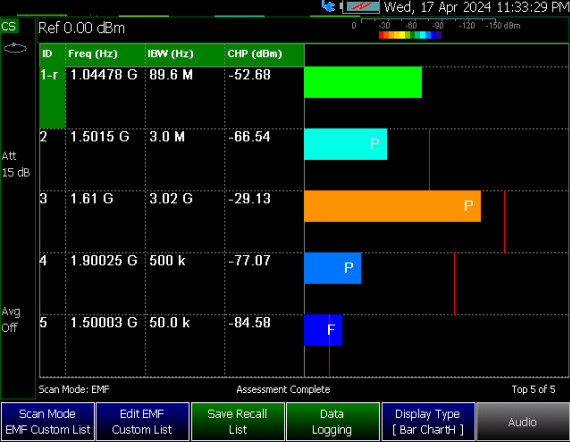
Figure 28-11 Channel Power Display Type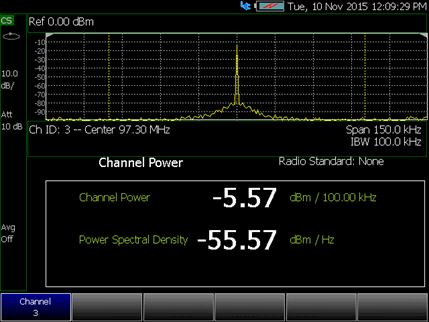
Figure 28-12 Table Display Type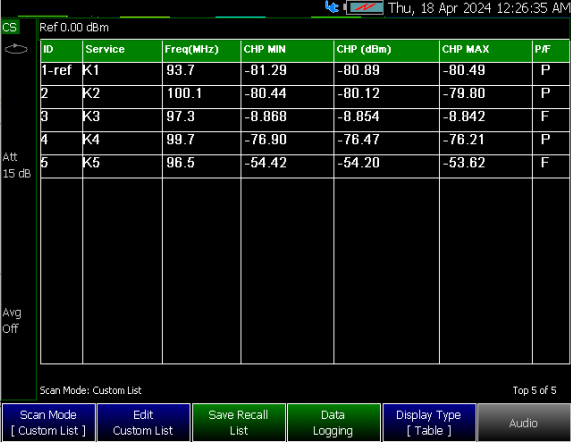
Figure 28-13 Table Display Type - EMF Custom List with Limit Line Configured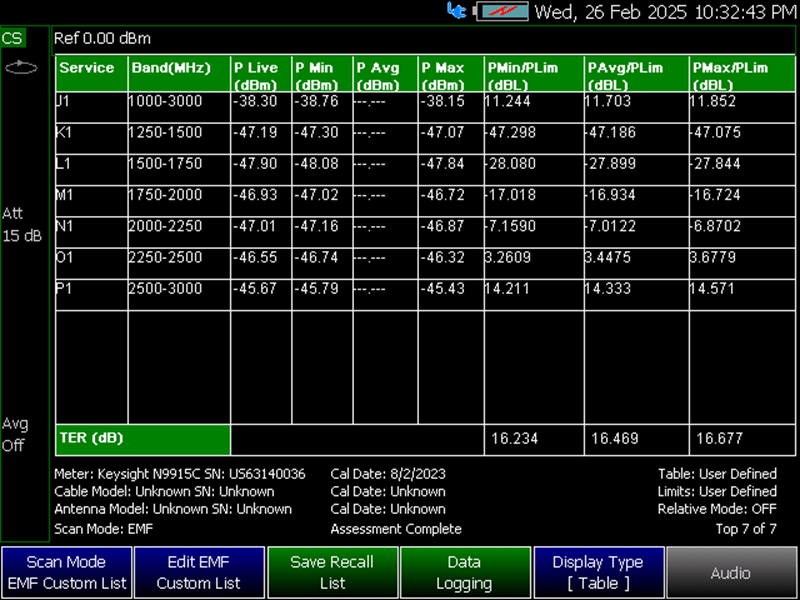
| In EMF Custom List scan mode Table, the P/PLim column will show data when EMF Custom List Upper limit or Limit Lines are configured. P/PLim represents the relative power compared to the limit. |
Figure 28-14 Strip Chart Display Type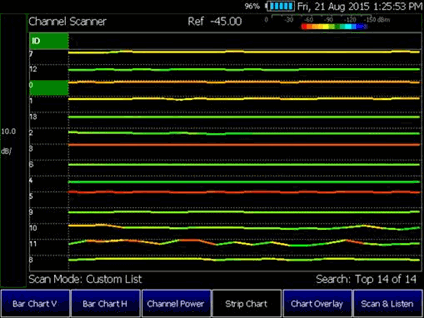
Figure 28-15 Strip Chart Overlay Display Type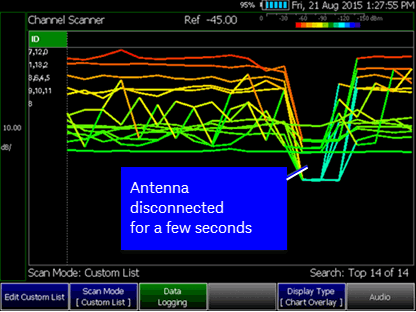
Figure 28-16 Scan&Listen Display Type
Step 3. Modify Scale and the Display Color Bar Settings
To modify the scale values:
1.Press Scale/Amptd > Scale and input desired scale value.
2.Then press dB/ to set the new scale unit.
To assign colors to low and high power values:
1.Press Scale/Amptd > Red Limit to set high power values and to set the color.
2.Press Blue Limit to set low power values and to set the color.
3.And, then press System > Display > Display Colors, to set Indoor, Outdoor, or other display colors. See also Chapter 28, “Channel Scanner (Option 312)”, on page 719.
Figure 28-17 Outdoor Display Colors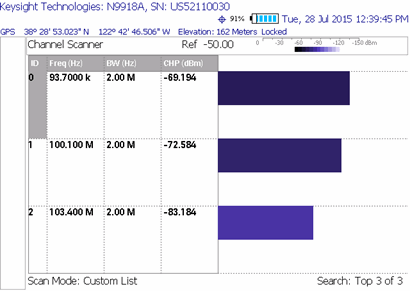
Figure 28-18 Indoor Display Colors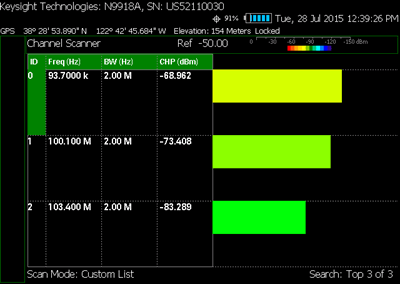
Step 4. Sort and Search softkey menu
Use the Sort and Search softkey menu to organize your data.
—Press Trace 6 > Sort and Search then choose from the following:
—Sort – Opens a softkey menu, then choose
——Sort Power Freq – Sort by frequency or power. Default is Sort by Frequency (Freq).
——Sort Order Up Down – Sort order of the frequency or power values can be done Up (increasing values) or Down (decreasing values).
—Next Page – Inactive by default.
——Press Search > Page to enable Next Page softkey if more than one page of data to display.
——Press Next Page to display next page list of data. Next page is disabled when you are at the bottom of the list.
—Previous Page – Inactive by default.
——Press Search > Page to enable Previous Page softkey if more than one page of data to display.
——Press Previous Page to display previous page list of data. Previous page is disabled when you are at the top of the list.
—Search Count (Default == Auto)
——Auto – FieldFox chooses the search count values based on other coupled settings. Only Custom List or EMF Custom List.
——User – Manual input the search count values then press Enter to set the search count for Search function. Only Custom List or EMF Custom List. Search Count indicates the number of displayed channel. The maximum number of channels that can be shown on the screen is 20. In Auto mode, the Search Count value will not be displayed on the button.
—Search – Choose from the following. Total data to display depends the Search Count setting.
——Top (Default) – Display data from the Top Channel ID.
——Bottom – Display data from the Bottom Channel ID.
——ID – Display data by specific Channel ID.
——Page – Display data by Page.
—Search ID – inactive by default.
——Pressing Search > ID enables Search ID softkey.
——Pressing Search ID enables editing of the Channel ID number to search and display the channel ID number entered in the screen.
—Next Page and Previous Page – inactive by default.
——Pressing Search > Page enables Next Page and Previous Page softkey if more that one page of data to display.
Step 5. Enable Data Logging and Play Results
Data logging records your data with a timestamp and GPS stamp (refer to “GPS – Distance Settings” on page 877). GPS must be enabled for the log results to include a GPS stamp.
Features
—Log files contain measured channel results including timestamps and/or distance stamps.
—Timestamps are included in log files with or without GPS.
—GPS must be enabled for log results to include distance stamps.
—Data results can be logged
—Data results can be saved to a *.CSV or *.KML file. Refer to “Step 6. Save the Log Results:” on page 745.
—User specifies how often results are stored.
—Time: Store results every “n” seconds
—Distance: Store results every “n” meters. GPS must be enabled to store results by distance.
Outdoor Mapping Procedure
For Indoor Mapping and more on Outdoor Mapping, see also Chapter 16 Mapping and “Option 352 Indoor Maps Setup Procedure” on page 515, “Option 352 Outdoor Maps Setup Procedure” on page 519, and “Setting up Data Logging” on page 527. See also, Chapter 33, “File Management.”
1.Press Measure 1 or Trace 6 > Data Logging
2.Outdoor Mapping Only: Press Record Settings then:
—Meas Interval OFF ON (Default == OFF) - set to ON
—Interval Type Time Distance (Default == Time) - choose a setting
—Time Interval 1 sec to 3,600 seconds or
—Distance Interval from 1m to 10 km
—When done, press Back
3.Press Record Save/Recall then:
—Save Log File
—Recall Log File
—File Folder Default System - (Default == Default).
—File Type - CSV or KLM
—Auto Save OFF ON - (Default == OFF). Press to enable/disable.
—then Back
Learn more, see “How to Set Up Channel Scanner” on page 721, step b.
4.To begin outdoor logging recording: Press Record
If Auto Save is On (Default == OFF) Measurements are stored automatically accorded to the specified time or distance interval values. Refer to step 5.
5.Optional: Auto Save OFF (Default)—When Auto Save is on, during recording, the FieldFox stores intermediate results in a temporary file. If the power fails during recording you can retrieve the results. Select Recall Log File. Select the temporary file name.
Press Record Save/Recall > Auto Save On Off
6.When done press Stop or Esc. The files save dialog is displayed. Edit the file name where the file results will be stored.
7.Press Done
Learn more, refer to Chapter 16 Mapping and “Option 352 Outdoor Maps Setup Procedure” on page 519 and “Setting up Data Logging” on page 527. See also, Chapter 33, “File Management.”
Playing a Data Log and Viewing the Spectrogram
To play the log results:
Refer to Figure 28-19 on page 745.
1.Press Data Logging > Play
2.Then choose:
—Optional: Use the RPG (fine adjust) or the arrow keys (coarse adjust) to change the color bar.
See also, “How to Set Up Channel Scanner” on page 721.
3.Press Stop or Esc to exit the log recording.
To pause the log play:
1.Optional: Press Pause Resume to pause or resume the log recording.
2.Then choose:
—Optional: Use the RPG (fine adjust) or the arrow keys (coarse adjust) to change the color bar.
—Cursor Position to change the position along the time record’s results (i.e., Cursor Position is active only when playback is paused).
—Maps > Red/Blue Limits then
——Red Limit to change the color bar.
——Blue Limit to change the color bar.
3.Press Stop or Esc to stop the log recording.
To View the spectrogram of recorded results:
1.Press View (Applies to Option 312 Only)
2.Then choose:
—Zoom to zoom in on spectrogram time record results.
—Red Limit to change the color bar.
—Blue Limit to change the color bar.
3.Press Exit or Esc to exit view.
Figure 28-19 Spectrogram View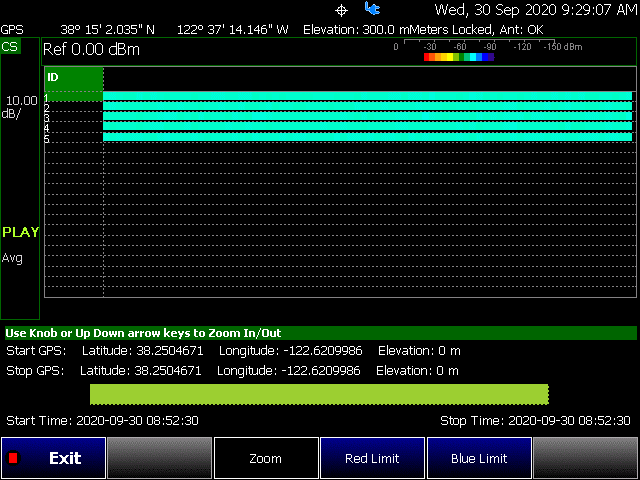
Two file types are supported for save or recall log results:
—KML file format
—Files include bar color
—Files stored in this format can be imported into 3rd party applications like Google Earth or Google Maps.
—CSV file format. Files stored into this format can be imported into spreadsheet applications.
1.Press Record Save/Recall > File Type CSV or KLM > Back
2.To begin recording: Press Record
Measurements are stored automatically according to the specified time or distance interval values.
3.When done press Stop. The files save dialog is displayed. Edit the file name where the file results will be stored.
4.Press Done
5.Optional: Auto Save ON (Default == OFF) — When Auto Save is on, during recording, the FieldFox stores intermediate results in a temporary file. If the power fails during recording you can retrieve the results. Select Recall Log File. Select the temporary file name.
Press Record Save/Recall > Auto Save On Off >On
Optional Step: Indoor Map Data Logging
Once you have selected a channel to measure, you can record data logging using Indoor Mapping. Refer to “Step 1A: Scan Mode – Range Channel Defined” on page 727.
Learn more, see “How to Set Up Channel Scanner” on page 721, step 5.
1.Press Measure 1 > Data Logging > More then
2.Press Indoor Map Data Logging then
—Record Indoor Data (new indoor mapping file (*.png)) or Recall Indoor Log File (recall a previously stored *.kdat, to modify). Learn more, refer to Chapter 16 Mapping and “Option 352 Indoor Maps Setup Procedure” on page 515 and “Setting up Data Logging” on page 527.
3.Measurements are displayed on the current indoor map in the specified intervals.
—Use More > Data Selection softkey menu to select the Channel displayed, the Sort Power Freq, and the Sort Order Up Down.
Then Back.
—Use the Labels & Icons softkey menu to select Labels OFF ON, Icons Flag Point Line, and Pointer OFF ON.
Then Back.
Learn more, refer to Chapter 16 Mapping and to “Enabling and Setting Up Indoor Map Logging” on page 530.
Use the Labels & Icons, RPG [Zoom] settings, Save Map, and Save Image (PNG).
Learn more, refer to Chapter 16 Mapping and to “Enabling and Setting Up Indoor Map Logging” on page 530.
—Use the PAN softkey menu to change locations on the indoor map.
4.To begin recording (add a data point): Press Record Data.
5.Optional: Set Bearing Line, refer to “Enabling and Setting Up Indoor Map Logging” on page 530.
6.Repeat steps 4 and 5 as necessary.
7.When done press Back or Esc. The files save dialog is displayed. Edit the file name where the file results will be stored as a *.kdat file.
8.Press Done
Learn more, refer to Chapter 16 Mapping and “Setting up Data Logging” on page 527. See also, Chapter 33, “File Management.”
Step 7. Import and Play back KML Files into 3rd Party Software (Example: Google Earth with Animation Tool)
Features
Use the Playback Slider to replay measurement results. See also Google Maps and or Google Earth’s help.
—Open the FieldFox *.KML file in Google Earth. Time Slider appears in upper left of the map.
—Manual Mode – Move the time slider cursor to see color-coded icons pop-up according to the timestamp.
—Loop mode has a Fast-Slow Replay Option.
—Click on each color coded balloon to see the table of measurement results for that location.
Figure 28-20 Importing a KML File Into Google Earth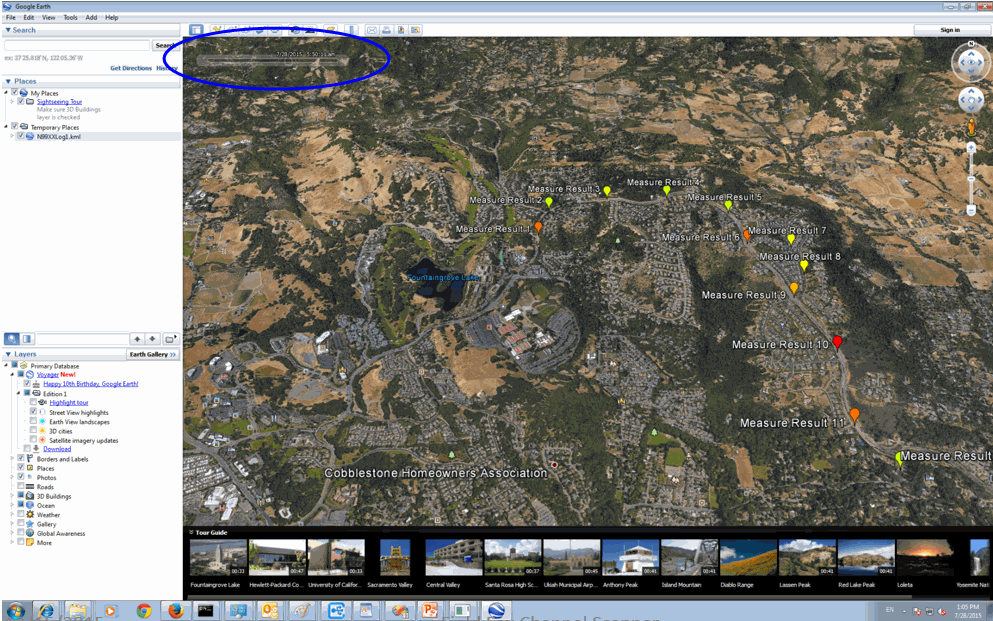
To measure the strength of any signal transmitted through the air, an antenna must be connected to the FieldFox. The Field Strength feature allows you to enter the frequency response of the receiving antenna (the Antenna Factor) and associated cabling, and then have amplitude corrections automatically compensate the displayed trace for that response.
Figure 28-21 Overview of Field Strength for Channel Scanner (See also, Figure 28-22 on page 749.)
Figure 28-22 Editing Antenna Factor (See also, Figure 28-21 on page 748.)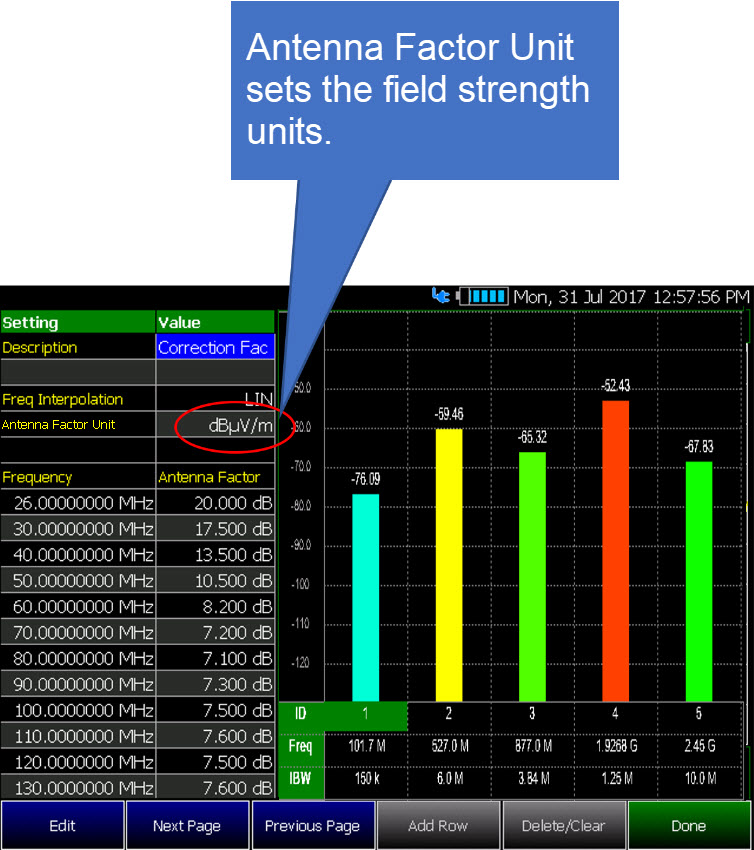
Figure 28-23 Yellow Trace with Cable and Antenna Corrections
Field Strength Measurements
Yellow Trace - Corrected trace with antenna factor. This correction, includes the sum of the antenna correction and the cable correction (These corrections are linearly interpolated). (Antenna == ON, Apply Corr == ON). Refer to Figure 28-23 on page 750.
For information, refer to “Trace Display States (SA mode)” on page 213
—Learn how to set Y-Axis Units on “How to Set Y-axis Units” on page 166.
—Use a Band Power marker to measure total power over a range of frequencies. Learn how in “Band/Interval Power Marker” on page 229
How to select and edit corrections for Field Strength measurements
The Antenna and Cable correction data survives a Mode Preset and Preset.
All Correction ON/OFF states survive a Mode Preset, but NOT a Preset.
—Press Scale/Amptd > More > Corrections
—Then choose from the following:
—Apply Corrections Auto Disabled Use Auto and Disabled correction for all settings.
—RcvrSide Antenna Off / On Edit/Recall an Antenna file to be used on the receiver side.
—RcvrSide Cable Off / On Edit/Recall a Cable file to be used on the Receiver side.
— View Corrections > View Corrections ON OFF Turn ON and OFF Yellow Trace - Antenna/Cable corrections. This is a composite of all cable/antenna corrections that are currently applied. Available as a useful visual aid, the zero “dB” level (no net correction) is mapped to appear at the –50 dBm on-screen level.
The following menu appears when any of the above Antenna or Cable softkeys are pressed:
—Antenna/Cable ON OFF Turn correction ON or OFF for this Antenna/Cable.
—Edit Antenna/Cable Edit an Antenna/Cable Correction table. See Using the Antenna/Cable Editor (below) for more information.
—New Create a new Antenna/Cable. See Using the Antenna/Cable Editor (below) for more information.
—Save Antenna/Cable Save the modified Antenna/Cable to a file on the specified Storage Device.
—Recall Antenna/Cable Read an existing Antenna/Cable file from the specified Storage Device.
—Storage Device Choose from: Internal, USB, SD. Learn more about these selections in “Set File Type and Select Device” on page 919.
When finished, press Back to return to the previous menu.
Field Strength Correction Examples
Refer to Figure 28-24 on page 752 and Figure 28-25 on page 753.
Figure 28-24 Apply Corrections Set to Auto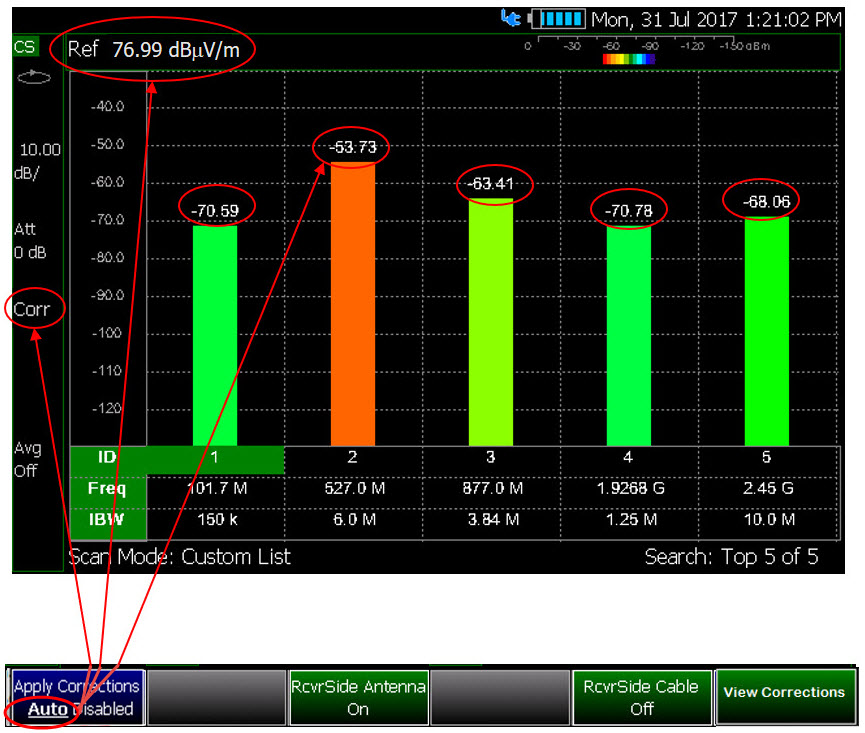
Figure 28-25 Apply Corrections Set to Disabled
Using the Antenna/Cable Editor
To learn more, refer to Chapter 9, “SA (Spectrum Analyzer) Mode (Option 233–Mixed Analyzers).” and to “Using the Antenna/Cable Editor” on page 171.
Channel Scanner mode has indoor and outdoor mapping capability. Refer to Chapter 16, “Indoor and Outdoor Mapping – Option 352 (Requires Spectrum Analyzer Mode (Option 233), and GPS Receiver (Option 307)).”
Extrapolation factor is a correction factor that is applied as an offset to channel power results. Whatever positive or negative value is set will be added to the channel power results. The setting is in dB, and if channel power results are in a linear unit form, the extrapolation factor will be applied before the channel power is converted to those units. There is no annotation on screen to indicate the extrapolation factor, but it will be logged when making a recording as part of the header metadata in the *.csv recording log file.
The Extrapolation Factor softkey is located here:
—Press Scale/Amptd > More > Corrections > More > Extrap... Factor
To edit, enter a negative or positive value in dB (Default == 0, Maximum == 100, Minimum == –100).
Learn more, refer to “Creating and Importing *.csv Limit Line Files” on page 841.
—To open the Uncertainty Table: Press Mode > More > Channel Scanner > Cal 5 > Uncertainty List.
To edit the Uncertainty List table click the right side column.
—To save Uncertainty List table values:
1.Press Save Recall Uncertainty List > Save Uncertainty List
2.Input filename
3.Press Done.
—To recall Uncertainty List table values:
1.Press Save Recall Uncertainty List > Recall Uncertainty List
2.Select filename to recall
3.Press Recall File.
Figure 28-26 Uncertainty List Table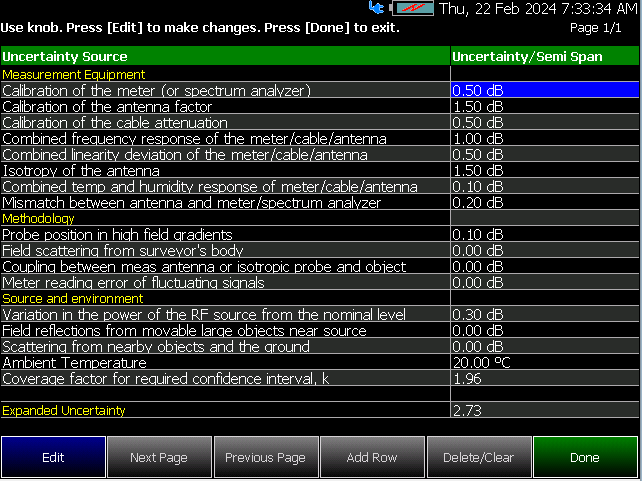
To learn more, refer to Chapter 9, “SA (Spectrum Analyzer) Mode (Option 233–Mixed Analyzers).” and to “Using the Antenna/Cable Editor” on page 171.
Using Resolution Bandwidth Tradeoff (Res BW Tradeoff)
This feature controls the resolution bandwidth for the current measurement.
To use this feature, press BW 2 > Res BW Tradeoff then choose from the following:
—High Sensitivity – Use this setting for greatest accuracy (Res BW == 1500).
—Medium – This is the default setting (Res BW == 450).
—Speed – When you want the fastest possible measurement (Res BW == 150). In EMF Custom List scan mode, the Res BW Tradeoff feature will be deactivated and switched to manual mode. Users will input these values manually in the EMF Custom List Table.