13Over–the–Air Measurements (OTA) – LTE FDD Option 370, LTE TDD Option 371, 5G NR / 5G NR EVM Conducted / 5G TF Option 378
Some examples in this chapter include the electromagnetic field (EMF) mode. EMF requires Option 358. See also, Chapter 9, “SA (Spectrum Analyzer) Mode (Option 233–Mixed Analyzers)”. |
OTA mode measures signals at the SA RF Input Port 2 connector.
OTA mode requires the FieldFox to have SA mode (Option 233 on combination analyzers), GPS (Option 307), and CPU2 installed.
5G NR requires 100 MHz wide path Option B10.
Recommended, but not required:
—Preamplifier (Option 235) to improve receiver sensitivity.
—EMF (Option 358) to measure the EMF levels of 5G signals.
With LTE FDD (Options 370), LTE TDD (Option 371), and 5G NR / 5G NR EVM Conducted / 5G TF (Option 378) network designers can ensure that networks have enough resources to carry out handovers (re-selection) when users move between cell towers on the same 5G network as well as in between 5G and 4G networks (intra/inter-radio access technology).
The FieldFox OTA measurements support LTE FDD (Option 370), LTE TDD (Option 371), and 5G NR / 5G NR EVM Conducted / 5G TF (Option 378) over-the-air demodulation for single or multiple component carriers (CCs) and multiple cell towers for each CC. Additionally, 5G NR EVM Conducted provides EVM measurement capabilities for conducted signals. The FieldFox display can be configured to show data formats such as table, bar chart, spectrum and strip chart of key performance indicators (KPI's).
By integrating over-the-air (OTA) measurements with cable and antenna test (CAT), full 2-port vector network analysis, spectrum analysis, and real-time spectrum analysis (RTSA), the FieldFox can be used for base station setup and verification.
See Also
Chapter 31, “System Settings.” (Changing display colors) |
Using OTA (Options 370 – LTE FDD, Option 371 – LTE TDD, Option 378 – 5G NR / 5G NR EVM Conducted) / 5G TF
OTA enables you to do the following:
a.When multiple component carriers are selected, the results of the component carrier (CC) with the highest power is displayed.
b.LTE FDD, LTE TDD, and 5G NR can measure and display multiple cells. 5G TF and 5G NR EVM Conducted only have the ability to measure and display a single cell.
c.With frequency extension via VDI and OML downconverter. Refer to Chapter 31, “System Settings.” and then “Utilities” on page 862.
About Over–the–Air (OTA) Measurements
OTA mode supports these standards:
—LTE FDD
—LTE TDD
—5G TF measurements
—5G NR
—5G NR EVM Conducted
Some measurement parameters are auto-coupled and are not user-settable.
LTE FDD and LTE TDD Features (Option 370 and Option 371) IMPORTANT! LTE FDD, LTE TDD, and 5G TF only demodulate PSS and SSS signals using the FieldFox’s demodulation path. User data channels are not demodulated.
LTE FDD and LTE TDD have the following features: IMPORTANT! LTE FDD and LTE TDD generally have similar cell features, but the Band and Channel choices are different for the Channel Table settings.
Cell Scan Results:
—Center frequency
—Physical Cell Indentifier (PCI) – (Cell ID–Sector ID–Group ID) – (C/S/G)
—RSRP (Reference Signal Received Power) (dBm)
—RSRQ (Reference Signal Received Quality) (dB)
—RSSI (Received Signal Strength Indicator) (dBm)
—PSS (Primary Synchronization Signal) (dBm)
—SSS (Secondary Synchronization Signal) (dBm)
—SINR (Signal to Interference & Noise Ratio) (dB)
—Frequency error (Hz)
Refer to step 11 in the “OTA Setup Procedure” on page 385.
Display Types:
User can set up and display 1, 2, 3 or 4 simultaneous measurements of key performance indicators (KPI's) for any component carrier (CC0 through CC4), up to 5 carriers, in any combination of the following:
—Table – Cell scan numeric results, including PCI, RSRP, RSRQ, RSSI, PSS, SSS, SINR and Freq Err, for up to 5 CCs or 6 cells
—Bar Chart – Vertical power bar graph of selectable cell scan result metric with adjustable color “heat” amplitude scale, for up to 5 CCs or 6 cells. And, color coded based on the selected scheme (i.e., CC, PCC, and Level). Refer to Figure 13-2 on page 374, Figure 13-3 on page 374, and Figure 13-4 on page 375.
—Spectrum – Magnitude frequency spectrum (fixed span) for a selected CC
—Strip Chart – Magnitude of selectable cell scan result metric graphed over time, for up to 5 CCs or 6 cells
Figure 13-1 Example of the LTE FDD with Four Multiple Display Options – (LTE TDD is similar)
Figure 13-2 LTE FDD Bar Chart – CC Example
Figure 13-3 LTE FDD Bar Chart – PCC Example 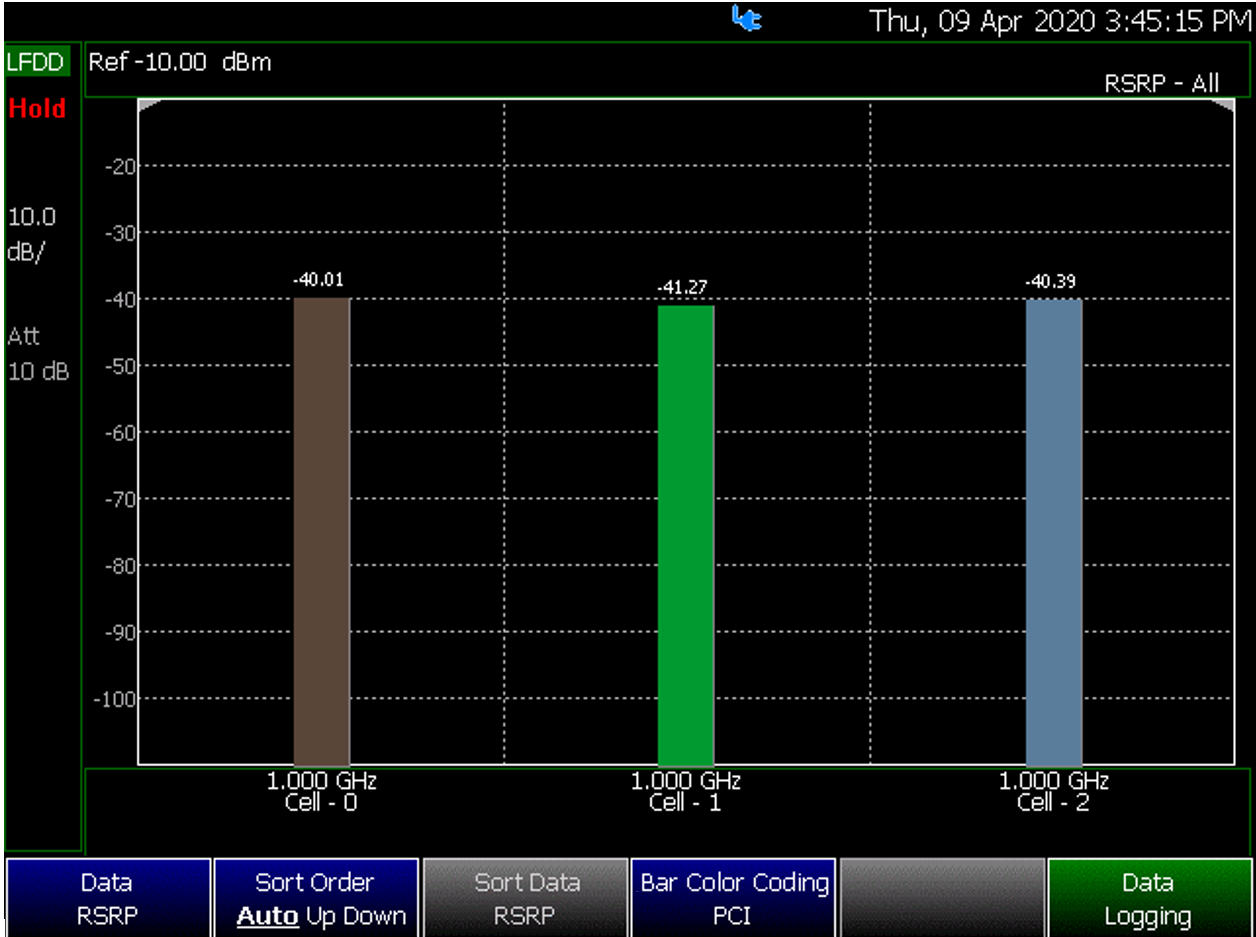
Figure 13-4 LTE FDD Bar Chart – Level Example 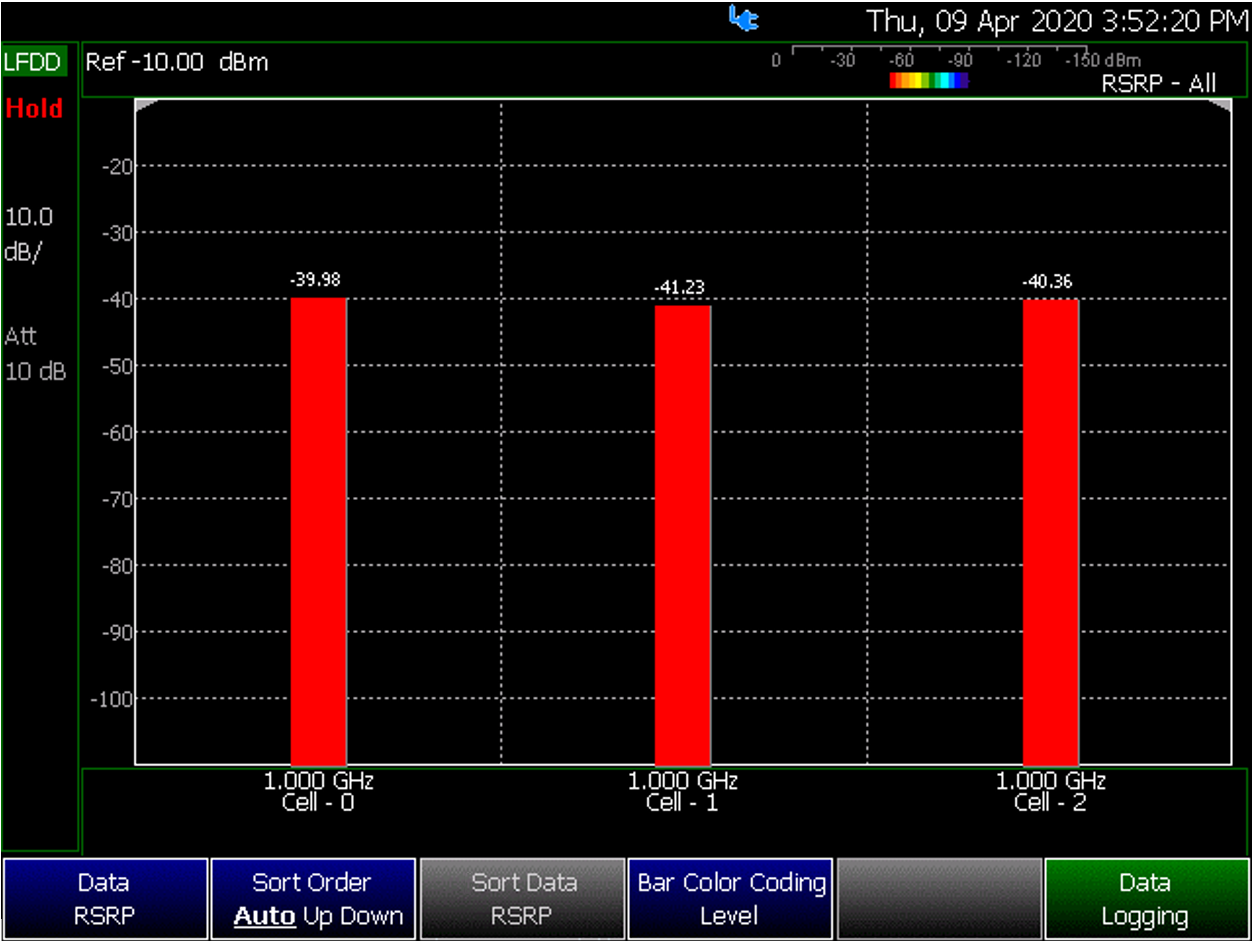
Figure 13-5 Example of the 5G TF with Four Multiple Display Options
Figure 13-6 Spectral Emission Mask Example
Figure 13-7 SSB Index Example 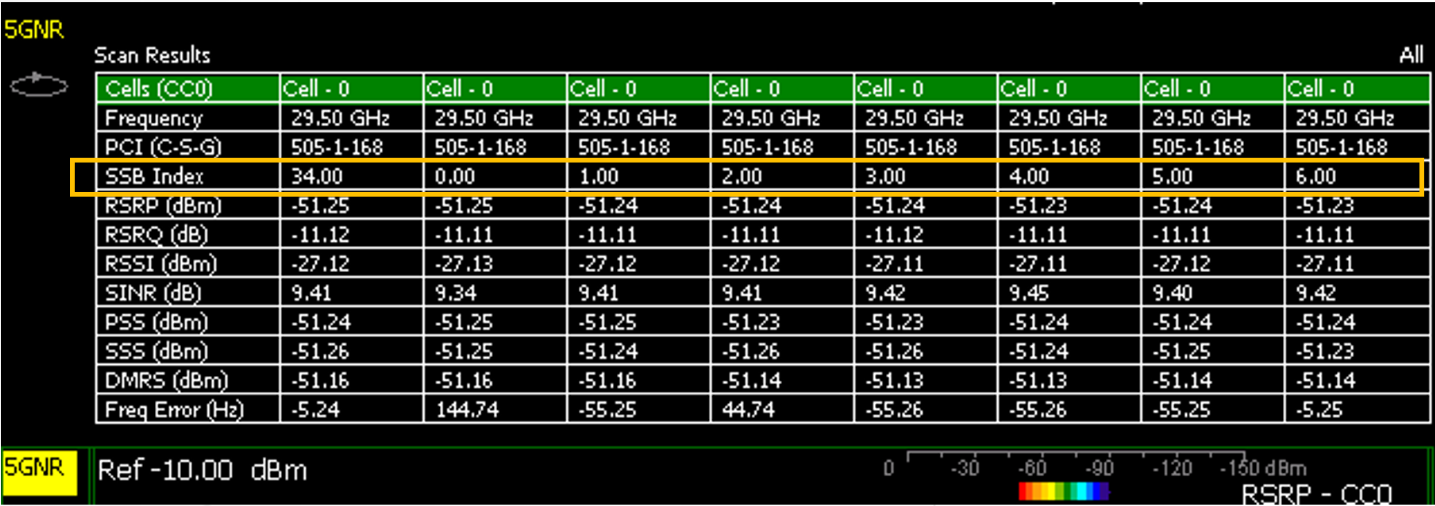
Figure 13-8 5G NR Center Frequency and SSB Offset, Before Multiple Cell IDs Example
Figure 13-9 5G NR Center Frequency and SSB Offset and SSB Index and PCI Single With Multiple Cell IDs Example 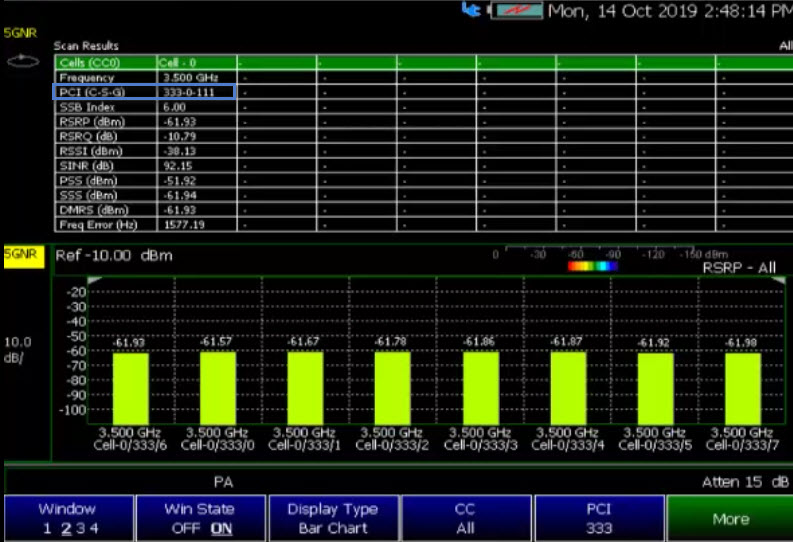
Figure 13-10 5G NR EVM Constellation Example – Measure Data set to All 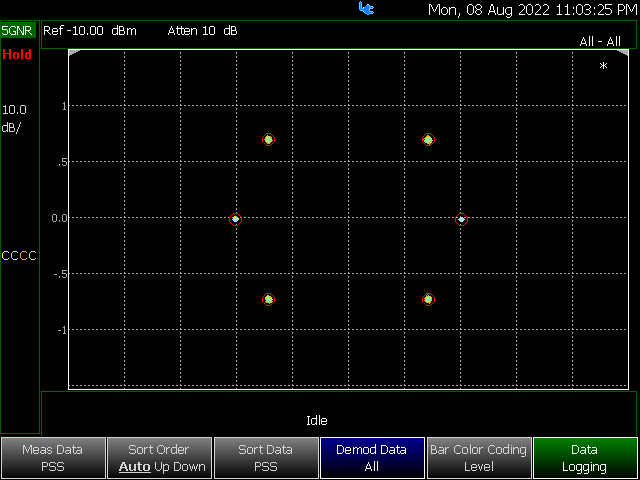
Figure 13-11 5G NR EVM Constellation Example – Measure Data set to PBCH 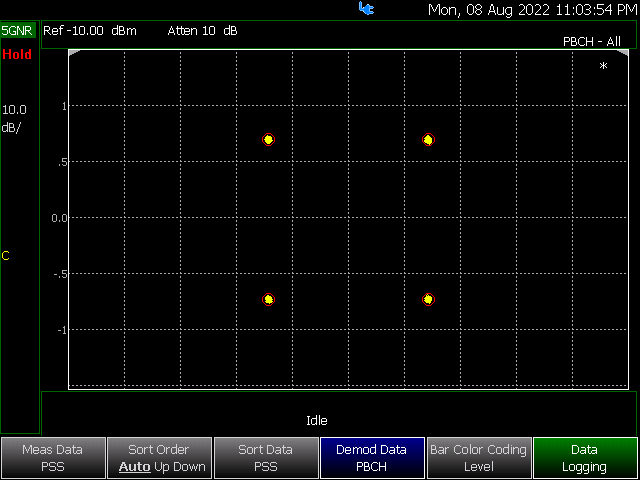
Figure 13-12 5G NR EVM Frame Summary Example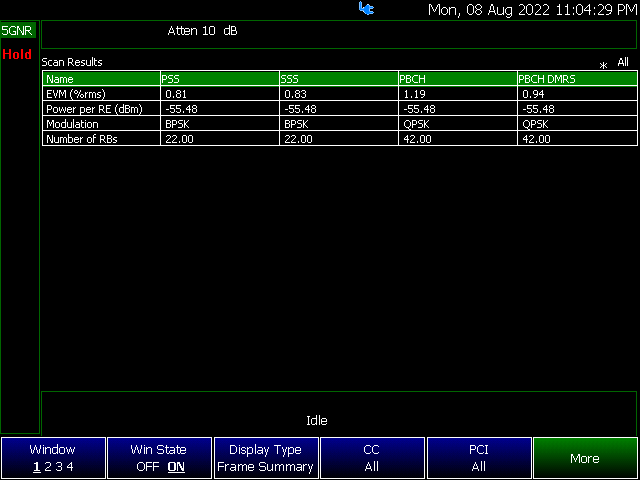
Figure 13-13 5G NR EVM – Constellation and Frame Summary Example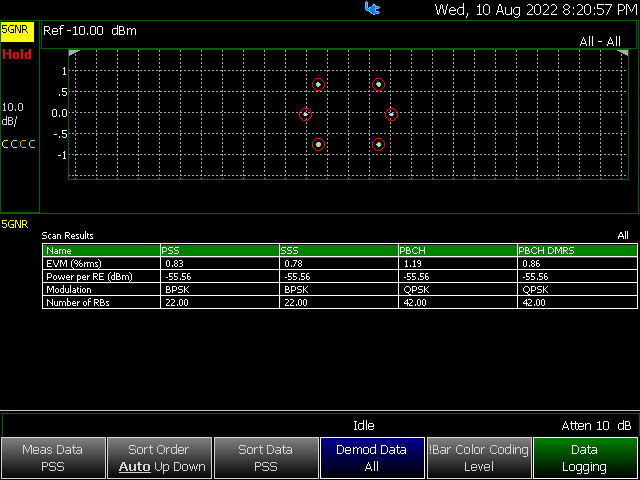
5G TF Features (P/O: Option 378) IMPORTANT! LTE FDD, LTE TDD, and 5G TF only demodulate PSS and SSS signals using the FieldFox’s demodulation path. User data channels are not demodulated.
5G TF has the following features:
Cell Scan Results:
—Center frequency
—Physical Cell Information (PCI) – (Cell ID)
—Power (Channel Power) (dBm)
—PSS (Primary Synchronization Signal) (dBm)
—SSS (Secondary Synchronization Signal) (dBm)
—Sync correlation (%)
Refer to step 11 in the “OTA Setup Procedure” on page 385.
Data Formats:
User can set up and display 1, 2, 3 or 4 simultaneous measurements of key performance indicators (KPI's) for any component carrier (CC0 through CC7), up to 8 carriers, in any combination of the following:
—Table – Cell scan numeric results (for up to 6 cell sites (ID's) including Cell ID, Channel Power, PSS, SSS, Sync Corr
—Bar Chart – Vertical power bar graph of selectable cell scan result metric for up to 8 cell sites with adjustable color “heat” amplitude scale. And, color coded based on the selected scheme (i.e., CC, PCC, and Level). See also, Figure 13-2 on page 374, Figure 13-3 on page 374, and Figure 13-4 on page 375.
—Spectrum – Magnitude spectrum frequency domain (fixed span). You can only view a single component carrier at a time with Spectrum (e.g., CC0 or CC2, etcetera).
—Strip Chart – Magnitude of selectable cell scan result metric graphed over time
Figure 13-14 Example of 5G TF Single Carrier and Single Cell
5G NR Features (Option 378) IMPORTANT! 5G NR only demodulates PSS, SSS and PBCH DMRS signals using the FieldFox's 100 MHz demodulation path. User data channels are not demodulated.
5G NR has the following features:
Refer to step 11 and “5G NR:” on page 393. See also, “5G NR EVM Conducted Features (P/O: Option 378)” on page 384.
Cell Scan Results:
—Center frequency
—PCI (Physical Cell Identifier) – (Cell ID-Sector ID-Group ID) – (C-S-G)
—SSB (Synchronization Signal Block) Index
—RSRP (Reference Signal Received Power) (dBm)
—RSRQ (Reference Signal Received Quality) (dB)
—RSSI (Received Signal Strength Indicator) (dBm)
—SINR (Signal to Interference & Noise Ratio) (dB)
—PSS (Primary Synchronization Signal) (dBm)
—SSS (Secondary Synchronization Signal) (dBm)
—DMRS (Physical Broadcast Channel Demodulation Reference Signal) (dBm)
—Frequency error (Hz)
—Time Offset (us) – Not shown in the 5G NR figures, but is part of the Carrier Info scan results.
Display Types:
User can set up and display 1, 2, 3 or 4 simultaneous measurements of key performance indicators (KPI's) for any component carrier (CC0 through CC7), up to 8 carriers, in any combination of the following:
—Table – Cell scan numeric results, including PCI, RSRP, RSRQ, RSSI, PSS, SSS, SINR and Freq Err, for up to 8 CCs and 6 cells for each CC
—Bar Chart – Vertical power bar graph of selectable cell scan result metric with adjustable color “heat” amplitude scale, for up to 8 CCs and 6 cells for each CC. And, color coded based on the selected scheme (i.e., CC, PCC, and Level). See also, Figure 13-2 on page 374, Figure 13-3 on page 374, and Figure 13-4 on page 375.
—Spectrum – Magnitude frequency spectrum (fixed span) for a selected CC
—Strip Chart – Magnitude of selectable cell scan result metric graphed over time, for up to 8 CCs and 6 cells for each CC
Figure 13-15 Example of 5G NR Single Carrier and Single Cell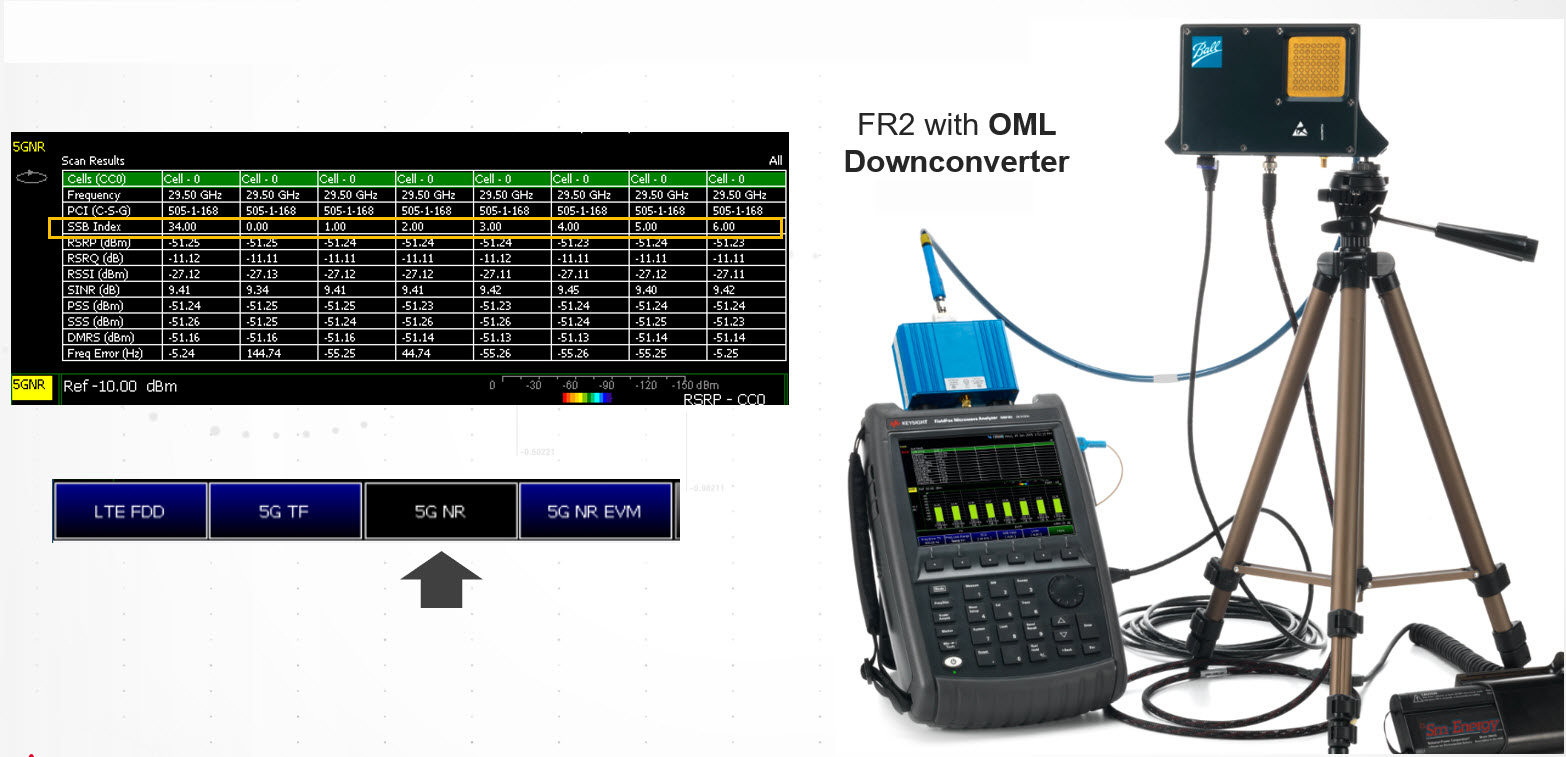
Figure 13-16 Example of 5G NR Multi-Beam – Displaying Multiple Beams From Cell Site 378
5G NR EVM Conducted Features (P/O: Option 378) IMPORTANT! 5G NR only demodulates PSS, SSS, PBCH and PBCH DMRS signals using the FieldFox's 100 MHz demodulation path. User data channels are not demodulated.
5G NR EVM Conducted can make EVM measurements of 5G NR signal synchronization channels. Refer to step 11, and “5G NR EVM Conducted NR:” on page 394, in section “OTA Setup Procedure” on page 385.
The FieldFox’s 5G NR EVM Conducted measurements are similar to the X-Series Multi-touch Signal Analyzers. For more on making FieldFox EVM-related measurements with the X-Series Multi-touch Signal Analyzers, refer to http://rfmw.em.keysight.com/wireless/helpfiles/5GNRMode/FlexUI.htm and then http://rfmw.em.keysight.com/wireless/helpfiles/5GNRMode/FlexUI.htm#meas_5gnr_evm/Modulation Analysis.htm content.
The FieldFox can make more comprehensive EVM measurements with the 89600 VSA software using the FieldFox's Remote Server feature. See the Chapter 18, “Remote Server Mode (Requires SA Option 233).”
| The FieldFox 5G NR EVM Conducted (p/o Option 378) does not have all of the features of a X-Series Multi-touch Signal Analyzers. |
How to Set Up Over–the–Air (OTA) Mode Settings
| IMPORTANT! See also, “Alignments” on page 219, in NA mode, Chapter 9, “SA (Spectrum Analyzer) Mode (Option 233–Mixed Analyzers).”. The FieldFox can be used with both VDI and OML frequency extender. Refer to “Utilities” on page 862, the Configuration Guide at: https://www.keysight.com/us/en/assets/3125-1447/configuration-guides/FieldFox-Handheld-Analyzers-D-models.pdf, and to “Contacting Keysight” on page 5. |
This section reviews the steps in setting up an OTA measurement. If you are not familiar with this process or would like more information, refer to “How to Define a Cell or Cell(s) and Use OTA”
This section consists of:
—“Optional: Using RTSA to verify the signal quality (Requires Option 350 and Preamp Option 235)”
1. Modifying the Frequency Reference and GPS settings:
Press System
—Then System Configuration) > GNSS (GPS+) > GNSS Receiver > Internal > Esc
—The left portion of the screen displays satellites and the corresponding number on the adjacent Satellite Power chart.
—The right portion of the screen displays Satellite Power Carrier to Noise (C/No) dBHz values on the tops of the satellite power chart.
—Then System > System Configuration > Frequency Ref > Freq Ref Source [GPS] >Back IMPORTANT! It is not sufficient to be locked to the GNSS satellite, the frequency reference must be locked to GPS.
For more information:
—And, refer to Figure 13-19 called, “Example of the 5G TF Scan Results Table (Two cc and one cell),” on page 400.
—And, refer to Figure 13-16 called, “Example of 5G NR Multi-Beam – Displaying Multiple Beams From Cell Site 378,” on page 383.
—See also “GNSS (GPS+) and GPS” on page 886.
2.Selecting OTA mode:
—Press Mode_.
—Then More (may not be available—number of installed options dependent)
—Then OTA.
3.Selecting an OTA format:
Press Measure – (When you initially select OTA mode, the FieldFox defaults to the Measure menu.)
—The Measure menu is used to select an OTA format (e.g., Option 370 LTE FDD, Option 371 LTE TDD, Option 378 5G NR, etcetera):
(Available modes are Option dependent.)
—LTE FDD (Default) or
—LTE TDD
—5G TF
—5G NR
—5G NR EVM Conducted
The OTA format chosen begins scanning for signals. Additional FieldFox setting changes are required for OTA to display the available signals. Refer to the steps below and see also, “How to Define a Cell or Cell(s) and Use OTA” on page 404.
4.Define some carrier and cell measurement information. See also, “How to Define a Cell or Cell(s) and Use OTA”.
Then modify the carrier and cells based on the selected OTA technology (i.e., LTE FDD, LTE TDD, 5G TF, and 5G NR /5G NR EVM Conducted).
| If after making the setting changes in the steps below, no data is displayed, refer to “Troubleshooting” on page 437. Display does not update (refresh), until all active component carriers (CCs) have been scanned. |
—Then CC CC0 (Default == CC0) – Selects the CC number to be displayed (LTE FDD/LTE TDD choices: CC0-CC4, 5G NR Choices: CC0-CC7). If only one CC is selected, the FieldFox will not allow you to disable the scan. See also, the Trace hardkey in step 7.
—Then Enabled ON (Default == ON) – Enables/disables the CC scan results. If only one CC is selected, the FieldFox will not allow you to disable the scan.
—Then Center – You can enter a center frequency, or for LTE FDD, LTE TDD, and 5G NR (only) you can use the Channel Table menu to enter an auto-coupled Center frequency (see LTE FDD, LTE TDD, and 5G NR Channel Table softkey menus below).
—Then Offset (Option 378 – 5G NR and 5G NR EVM Only) – You can enter an synchronization signal block (SSB) offset frequency.
6.Optional (Option 370 – LTE FDD, Option 371 – LTE TDD, and Option 378 – 5G NR /5G NR EVM Only): Press Freq/Dist > Freq Mode > Chan
This changes the Center frequency value.
Press Channel Table opens a softkey menu, where you can select define your carrier, by Band and Channel. The Center frequency value is auto-coupled to the Band/Channel entered.
Option 370 LTE FDD and Option 371 LTE TDD Only:
—Then Band > n > Enter
(The Channel, Band, and the Center values are auto-coupled.)
Band and Channel values vary between LTE FDD and LTE TDD. |
—Then Favorites List (Option 370 LTE FDD and Option 371 LTE TDD Only) opens a softkey menu, where you can save your current Band and Channel setup.
—Then Setup 1 In the Favorites list softkey menu, the softkey displays the current Band and Channel displayed (e.g., Setup 1 3,1200). Select the Favorites List softkey again to observe the updated Setup 1 softkey.
—Then Back
Option 5G NR /5G NR EVM Only):
—Then Band > n > Enter
(The Channel, Band, and the Center values are auto-coupled. frequency Offset is settable.)
—Then Channel Raster (Option 378 5G NR /5G NR EVM Only) opens the Channel Raster softkey menu.
—Then Channel ARFCN Sets the Absolute Radio-Frequency Channel Number signal to be measured. Setting an ARFCN automatically sets a corresponding Center frequency for the component carrier.
—Then Center sets the ARFCN center frequency.
—Then Offset sets the offset from the Center frequency.
—Then Sync Raster (Option 378 5G NR and 5G NR EVM Only) opens a softkey menu, where you can set the Global Synchronization raster Channel using wider SSB frequency search. Sync ARFCN is coupled with Sync GSCN. ARFCN and GSCN minimum and maximum values vary with band setting and licensed frequency.
—Then Sync ARFCN sets the ARFCN reference signals to be synchronized.
—Then Sync GSCN sets the GSCN signals to be synchronized.
—Then Center sets the GSCN center frequency.
—Then Offset sets the offset from the Center frequency.
—Then Back
—Window 1 2 3 4
— Then Win State OFF ON to ON
— Then Display Type
—Table or
—Bar Chart or
—Spectrum or
—Strip Chart or
—Constellation (5G NR EVM only) or
—Frame Summary (5G NR EVM only)
| The Spectrum view in 5G TF uses a center frequency that is +2.6 MHz offset from the carrier’s center frequency. This is done so that FieldFox can capture the necessary xPBCH (physical broadcast channel) information to demodulate the signal. Be aware that all of the instrument’s displayed numbers are rounded to three significant digits (e.g., 5.0026 GHz is displayed as 5.003 GHz). |
— Then CC (select component carriers)
—All (Not applicable for Spectrum. When All is specified, for Spectrum, the FieldFox Defaults == CC0) or
—CC0, CC1, CC2, CC3, or CC4 (i.e., 5G TF and 5G NR have up to eight component carrier choices (CC5, CC6, and CC7))
Repeat process as needed for additional Windows, Data, and CC settings. IMPORTANT! When multiple component carriers are selected, the results of the component carrier (CC) with the highest power are displayed. Refer to Figure 13-17 on page 399.
a.When Display Type is set to Bar Chart or Strip Chart then for all for all OTA Options: Press Trace 6 > More
—Then Meas Data n – Then select the data type:
LTE FDD and LTE TDD: RSRP, RSRQ, RSSI, SINR, PSS, SSS (Default == RSRP).
5G TF: PSS, SSS or Power (Default == PSS).
5G NR: RSRP, RSRQ, RSSI, SINR, PSS, SSS or DMRS
(Default = = RSRP).
5G NR EVM: RSRP, RSRQ, RSSI, PSS, SSS, PBCH, DMRS, or Power (Default == PSS).
—Then Sort Order and choose Up or Down (Default == Auto). Refer to “About Over–the–Air (OTA) Measurements” on page 372. When this softkey is inactive the Sort Order is set to Auto.
—Then Sort Data n – Then select the type of data to be sorted:
LTE FDD and LTE TDD: RSRP, RSRQ, RSSI, SINR, PSS, SSS, Freq Error.
5G TF: PSS, SSS, Power, Sync Corr.
5G NR: RSRP, RSRQ, RSSI, SINR, PSS, SSS, DMRS, Freq Error, SSB Index.
5G NR EVM: RSRP, RSRQ, RSSI, PSS, SSS, PBCH, DMRS, Power, Sync Error, Time Offset, PSS EVM, SSS EVM, PBCH EVM, DMRS EVM, Composite EVM.
—Then Data Logging – to record data. Refer to “How to Use Data Logging (OTA Options 370, 371, and 378)” on page 428.
b.5G NR Only:
Press More
—Then SSB Index All Single when the SSB value is set, the SSB Index mode is automatically set to single. SSB Index values are for the currently displayed cell results.
Enabling and disabling multi-beam display is useful when displaying the results from multiple cells.
—Then Multi-Beam OFF ON enable/disable Multi-Beam. Enables/disables displaying multiple beams (SSB results) for the currently displayed cell results.
Enabling and disabling multi-beam display is useful when displaying the results from multiple cells.
—Then Next Result Set updates the Scan Results table with the next set of scanned data
c.5G NR EVM Only (When Display Type is set to Constellation or Frame Summary):
Press More
—Then Demod Data All choose the demodulation data type: PSS, SSS, PBCH, PBCH DMRS, or All (Default == All).
—Then Data Logging – to record data. Refer to “How to Use Data Logging (OTA Options 370, 371, and 378)” on page 428.
9.Optional: Display Type Table – Different softkey menus are displayed for up to six different Display Types: Table (default), Bar Chart, Spectrum, and Strip Chart, Constellation and Frame Summary (i.e., Constellation and Frame Summary are on available when measurement is set to 5G NR EVM):
a.Optional (When Display Type == Table or the More softkey is pressed for the other Display Types): Modify RF attenuator, Preamp, and other settings:
If Display Type == Table, then press Scale/Amptd or
If Display Type == Bar Chart, Spectrum, or Strip Chart, then press Scale/Amptd > More
Then choose from the following:
—Press RF Atten to set the attenuator power (Default == –10 dB). Set to 0 dB.
—Press Preamp change to ON.
—Press Range to set the absolute power (dBm)
—Press Auto-Range Executes an auto-range, which determines the optimal RF attenuation and preamp settings for the current input signal.
Executing an auto-range does NOT change any of the display settings (i.e., Ref Level, Scale or Ref Pos).
See also, “About the Auto-Range Feature” on page 433.
—Press External Gain
b.Optional (When Display Type == Bar Chart): Modify scale and specify color bar limit values—Modify the bar chart display color coding scheme for the power channels (bars):
Press Trace > More > Bar Color Coding
Then one of the following:
—CC to set the CC (Component Carrier) associated with each bar.
—PCI to set the PCI (Physical Cell Identifier) associated with each bar.
—Level to set the level of the value associated with each bar.
When level is selected, you can set the channels’ red and blue power level limits with the Scale/Amptd softkeys:
Press Scale/Amptd
Then one of the following:
—Red Limit to set the power level and color scale for high power channels.
—Blue Limit to set the power level and color scale for low power channels.
—Others: Scale, Ref Level, etcetera as desired.
—More opens a menu of softkeys that are the same as those that are defined when the Display Type == Table.
—Others (optional): Autoscale
c.Optional (When Display Type == Spectrum): Modify RF attenuator, Preamp, and other settings:
Press Scale/Amptd
Then press the following:
—Ref Pos Manually set the position of the reference line. Values must be between 0 (TOP line) and 10 (BOTTOM line).
—Scale Manually enter a scale per division to view specific areas of the trace.
—Ref Level Manually set the value of the reference line. Enter a negative value by pressing Run/Hold (+/-) either before or after typing a value.
—More opens a menu of softkeys that are the same as those that are defined when the Display Type == Table.
—Others (optional): Autoscale
d.Optional (When Display Type == Strip Chart): Modify RF attenuator, Preamp, and other settings:
Press Scale/Amptd
Then press the following:
—Scale Manually enter a scale per division to view specific areas of the trace.
—Ref Level Manually set the value of the reference line. Enter a negative value by pressing Run/Hold (+/-) either before or after typing a value.
—More opens a menu of softkeys that are the same as those that are defined when the Display Type == Table.
—Others (optional): Autoscale
e.Optional (When Display Type == Constellation or Frame Summary): Modify RF attenuator, Preamp, and other settings:
Press Scale/Amptd and
Then choose from the following:
—Press Range to set the absolute power (dBm)
—Press External Gain
10. Optional: Modify scale and specify color bar limit values—Modify the scale and assign colors to low and high power channels (bars):
Press Scale/Amptd
Then one of the following:
—Red Limit to set the power level and color scale for high power channels.
—Blue Limit to set the power level and color scale for low power channels.
—Others: Scale, Ref Level, etcetera as desired.
11. Optional (i.e., If the Scan Results table does not populate): Press Meas Setup 4
—LTE FDD and LTE TDD:
—Then FreqError Th > 5 kHz (enables data with larger frequency error to be displayed)
or Extend Freq Lock > ON (disables FreqError Th softkey and displays all available cell results. (This may result in longer scan times, because display does not update until all potential cells and their frequency offsets are detected between signal and the OTA center frequency.)
—LTE TDD (Only): UL-DL Config (selects the type of Uplink-Downlink switch-point periodicity configuration). Choose from Config 0 (default) through Config 6.
—MBSFN (opens a menu to configure the Multi–broadcast Single Frequency Network (MBSFN) frames to transmit 5G NR control channels (SSBs) and can be used to enable dynamic spectrum sharing (DSS)).
——MBSFN OFF ON – Enables the MBSFN frames for NR control channels (SSBs). (Default == OFF.)
——Toggle All Subframes – Enables or disables all of the MBSFN frames. Enabled by default when MBSFN is set to ON.
——Subframe 3 OFF ON – Enables or disables subframe 3 as one of the MBSFN frames for NR control channels (SSBs). Subframe 4 OFF ON, Subframe 7 OFF ON, Subframe 8 OFF ON, and Subframe 9 OFF ON are similar to Subframe 3.
——More – Opens a menu to enable/disable the Subframe 8 and Subframe 9 MBSFN frames that are NR control channels.
—5G TF: Then SyncCorr Th > 0% (enables data with greater than 0% of the specified Sync Correlation percentage to be displayed)
—Then FreqError Th > 7.5 kHz (enables data with larger frequency error to be displayed)
—Then SCS Sets the data channel sub-carrier spacing: 15 kHz, 30 kHz, 120 kHz, or 240 kHz (Default == 30 kHz).
The SCS is coupled to the Center Frequency setting based on the 5G NR FR1 & FR2 frequency ranges.
—Then SSB Case Sets the signal SSB case: A, B, C, D, or E (Default == Auto).
—Then Lmax Sets the current half frame SS/PBCH blocks indexing in ascending order in time 0 to (Lmax – 1). Choices are 4, 8, or 64 (Default == Auto).
—Then More opens a menu for Capture Length, Drive Speed, SS Meas DMRS, SSB Offset Detection, LTE Coexistence (NSA / DSS), EMF, Advanced. See also, “How to Define a Cell or Cell(s) and Use OTA” on page 404.
——Then Advanced opens a menu for Capture Length, Drive Speed, Phase Comp, SS Meas DMRS. See also, “How to Define a Cell or Cell(s) and Use OTA” on page 404.
—Then Cell ID Auto Sets the Cell ID to Auto or to Manual (Default == Auto).
—Then Bandwidth Sets the FR1 / FR2 bandwidth (Default == FR1 100 MHz).
—Then Resource Grid Opens a softkey menu to select the component carrier and optionally export scan results to 5G NR.
——Then SCS Auto - the SCS value is coupled to the center frequency and FR1 and FR2. Manual choices are 15 kHz and 30 kHz. Default == Auto.
—— Then Grid Start only settable when SSB Auto is set to OFF. Default == 0.
—— Then Grid Size only settable when SSB Auto is set to OFF. Default == 273.
——Then Export to 5G NR Setup – Export the current scanned table of information to 5G NR.
—Then SSB Opens a softkey menu to select the SSB settings that are coupled to the Resource Grid SCS setting.
——Then SSB Auto-Detect OFF ON - Enables/disables SSB Auto-Detect state. When SSB auto-detection is enabled, the SSB offset, SSB Case, Lmax, Periodicity and, optionally, SCS are all auto-detected in the measurement. When disabled, the settings can be set manually. Default == ON.
——Then SSB Offset - Opens a menu to set the SCS values.
SCS Common | The signal sub-Carrier Spacing Common setting is coupled to the Bandwidth setting. When an FR1 bandwidth is selected, 15 kHz & 30 kHz SCS are available; When an FR2 bandwidth is selected, 60 kHz SCS & 120 kHz SCS are available. |
RB Offset | Sets the Resource Block (RB) offset of the signal SSB relative to CRB0. Choices: Min: Dynamic. Varies based on the Resource Grid Start setting. Max: Dynamic. Varies based on the Resource Grid Start and Grid Size settings. |
kSSB | Sets the kSSB of the signal SSB. Choices: Min: 0 Max: Dynamic. Varies based on the Resource Grid SCS setting. |
——Then SSB Case – Sets the SSB Case when SSB Auto-Detect is disabled. This setting is coupled to the Resource Grid SCS setting. Choices: 15 kHz SCS - Case A, 30 kHz SCS - Case B & C, 120 kHz SCS - Case D, and 240 kHz SCS - Case E.
——Then Lmax – Sets the Lmax when SSB Auto-Detect is disabled. This setting is coupled to the Bandwidth setting. Choices: an FR1 bandwidth is selected, 4 and 8; When an FR2 bandwidth is selected, 64 is available.
——Then SSB Periodicity – Sets the SSB Case when SSB Auto-Detect is disabled. Choices: 5 ms, 10 ms, and 20 ms.
—Then Results –> Setup Opens a softkey menu to select the component carrier and optionally export scan results to 5G NR.
——Then CC CC0 - Selects the cc signal information to be scanned (CC0 to CC4). Default == CC0.
——Then Copy to Manual Setup - Selects the cc signal information to be copied to the manual SSB.
——Then Export to 5G NR Setup – Export the current scanned table of information to 5G NR.
—Then Advanced Opens an Advanced softkey menu.
——Then Phase Comp- Enables/disables phase compensation.
—Once the table populates, enter the desired frequency error (LTE FDD, LTE TDD, and 5G NR), Sync Correlation (5G TF) threshold for your measurement (LTE FDD and LTE TDD: Default == 900 Hz, i.e., if a carrier signal’s error is greater than 900 Hz, no data is displayed. 5G TF/5G NR/5G NR EVM Conducted: Default == 1%, i.e., if a carrier signal’s sync correlation is smaller than 1%, no data is displayed).
If after making the setting changes in this section, no data is displayed, refer to “Troubleshooting” on page 437. Display does not update (refresh), until all active component carriers (CCs) have been scanned. |
12. Enable the Data Logging settings:
—Press Trace 6 > More (All Modes) > More (5G NR only) then Data Logging to view the Data Logging softkeys and set the Record Settings, Record Save/Recall, and Indoor Map Data Logging
—Record (Outdoor Logging) or
—Play (If you have previously stored data recordings.) Spectrum and Strip Chart information is not recorded. Only the Table and Bar Chart data are saved. See “How to Record a Data Log Procedure” on page 429. Data Log-Play files are saved to: —If File Folder is set to Default then Data Log-Play files are save-recalled to: "[CurrentDevice]\RecordPlayback\OTA". —If File Folders are set to System, then Data Log-Play files are save-recalled to: "CurrentDevice\<UserSelectedFolder>\".
a.To set the Record Settings (Outdoor Mapping only) — then choose:
—Then Meas Interval > ON
—Then Interval Type > choose Time or Distance.
—Then, if applicable Time Interval enter time interval in seconds.
Or
—Then, if applicable Distance Interval enter distance interval in miters.
—Then Back
b.Then press Record Save/Recall To set file settings choose
| Learn more about file settings, refer to Chapter 33, “File Management.”. |
—Save Log File to save the current Table data (i.e., default save device is Internal). i.e., *.KML or *.CSV (default) files are saved to the file name and device type. See Settings below and “To change Data Logging Configuration settings:” on page 430
—Recall Log File select a filename from the list
—File Folder
Default - selects [Internal]:RecordPlayback\OTA (default) or System - selects [Internal] top of internal directory.
—Device choose where to store your data files
—File Type > CSV or KML choose a file type (Default == CSV)
—Auto Save OFF (Default)/ON. When enabled, a temporary log file (e.g. TempAutoSave.csv) is automatically saved after each new record is recorded to guard against data lose in the case of an unexpected shutdown. The temporary log file is automatically deleted after you stop recording and manually save the log file.
or
—Back
c.Indoor Map Data Logging - then Record Indoor Data or Recall Indoor Log File.
—Then choose Navigate OFF ON, Data Selection, Zoom, Pan, Record Data, More
Learn more, refer to Chapter 16 Mapping and “Setting up Data Logging” on page 527. See also, Chapter 33, “File Management.”
13. Outdoor Mapping only: If recording, then:
—View Map OFF ON To enable/disable the current map view (Default == latitude/longitude == 0.00/00. Need GPS to view current location (Default == OFF).
— Pause Resume Temporarily halts recording until pressed again. The incoming trace continues to sweep. Press again to continue recording.
—Stop Immediately stops recording and a “Save the Log File” menu opens to rename and save your data log file.
—(Press Record to begin a new recording.)
—Then Maps To enable map view and related features (e.g., Data Selection, Red/Blue Limits, Labels & Icons, Zoom).
—Data Selection Opens a softkey menu to set the active data channel, sort type, and sort order. See also previous step 8 above.
—Red/Blue Limits Opens a softkey menu to assign power values to the red (high power limits) and blue (low power limits) heat map display limits (defaults: Red Limit == –20 dBm, Blue limit == –90 dBm).
—Labels & Icons Opens a softkey menu to enable/disable map data point labels and icon types.
Labels OFF ON | Enables/Disables map data point labels. When enabled, a label is displayed for every map data point (e.g., “Data 1”). When disabled, labels are not displayed for the map data points. |
Icons | Sets the type of icon that is used to display a map’s data points (Default == Flag). |
— Save Image (PNG) Saves the current displayed map to a *.png file (default filename is “MapImageFile”).
| Data Log-Play files are saved to: —If File Folder is set to Default then Data Log-Play files are save-recalled to: "[CurrentDevice]\RecordPlayback\OTA". —If File Folders are set to System, then Data Log-Play files are save-recalled to: "CurrentDevice\<UserSelectedFolder>\". |
14. Export KML file into 3rd party mapping software (i.e., Google Map or Google Earth). Refer to “Step 6: Import and Play back KML Files into 3rd Party Software (Example: Google Earth with Animation Tool)” on page 418.
Figure 13-17 Single cell selected, but other cells displayed when CC0 to CCn has been enabled. If ALL is selected, only the CC with the highest power is displayed. (Not all of the detected data is displayed.)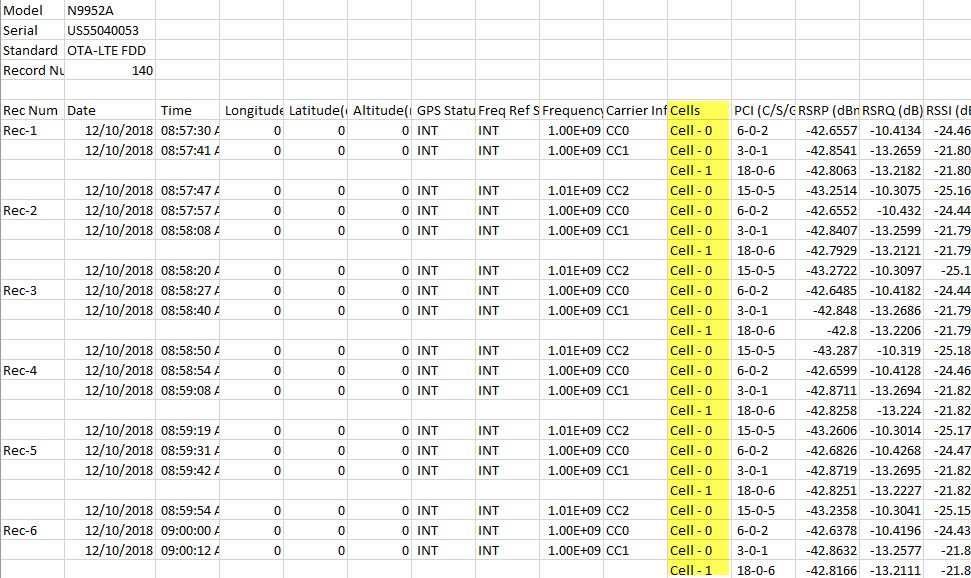
Figure 13-18 Example of the LTE FDD Scan Results Table (Five CCs and one cell) – LTE TDD is similar1
Figure 13-19 Example of the 5G TF Scan Results Table (Two cc and one cell)
Additional LTE FDD Examples (LTE TDD is Similar)
Figure 13-20 Example of LTE FDD with Single Carrier, Multiple Cell Sites, KPIs
Figure 13-21 Example of LTE FDD with Multiple Carriers, Single Cell Site, and KPI’s
Optional: Using RTSA to verify the signal quality (Requires Option 350 and Preamp Option 235)
—Press Mode > RTSA
—Then Density Spectrum (Default)
—Press Freq/Dist > Center (Default) > 751 MHz
(For this example, Center == 751 MHz.)
—Press Scale/Amptd
—Then Preamp [ON]
—Then Ref Level (Default). Then use the  arrows, the rotary knob, or numeric keypad to position the trace for optimum viewing on the FieldFox display. Refer to Figure 13-22 on page 403.
You should see a ~20 dB or greater LTE FDD signal–to–noise level. If not refer to “Troubleshooting” on page 437.
Figure 13-22 Using RTSA to verify LTE FDD 751 MHz signal quality–20 dB Signal to Noise Displayed (Requires Option 350 and Preamp Option 235)
How to Define a Cell or Cell(s) and Use OTA
LTE FDD, LTE TDD, 5G TF, 5G NR, and 5G NR EVM Conducted have only one predefined view (Table). You can define measurements, which can be used to display up to four different views (windows) simultaneously on the display screen. You can select which type of data to display in each of the views from the Trace menu.
Cell definitions consist of the following:
—Set frequency according to DUT requirements
—Define cell settings
—Define component carrier(s) (CCs) settings
Example: Using OTA LTE FDD or 5G TF, refer to:
Then:
—“Step 2: Select Trace Type” on page 410
—“Step 3. Modify Scale and the Display Color Bar Settings” on page 412
—“Step 4: Enable Data Logging and Playback the Results” on page 413
—“Save 5: Save the Log Results:” on page 417
Figure 13-23 Cell Definition (LTE FDD) – (LTE TDD is similar)
Step 1: LTE FDD (Option 370), LTE TDD (Option 371), and 5G NR / 5G NR EVM Conducted / 5G TF (Option 378): Component Carrier (CC) and Cell Defined
1.Press Preset then Mode Preset (Factory)
2.Selecting and OTA mode: Press Measure > LTE FDD or LTE TDD or 5G TF or 5G NR or 5G NR EVM Conducted
3.Optimizing the FieldFox to scan for signals:
—Set the System > System Configuration > Frequency Ref > Freq Ref Source [GPS] >Back
—Set the GNSS (GPS+) > GNSS Receiver > Internal > Esc
See also “GNSS (GPS+) and GPS” on page 886.
—Set the Scale/Amptd to:
—RF Atten > 0 dB
—Preamp > ON
—Set the Freq/Dist > then optionally:
All Measurement Setups:
—Press CC CCO
—Press Enabled OFF ON Enable/disable selected component carriers. If only one CC is enabled, the OFF key press is ignored (Default == ON).
—Press Center to select the currently displayed component carrier center frequency.
For LTE FDD and LTE TDD (instrument dependent)
—Optional (LTE FDD and LTE TDD only):
——Freq Mode > Chan
——Then Channel Table – Opens a menu to choose your CC, Band, Channel, and then use Favorites List, to open a softkey menu to save your Setup n.
For 5G NR (instrument dependent)
—Optional (5G NR only):
——Offset frequency offset of the measurement frequency from the center frequency
——Freq Mode > Chan
——Then Channel Table – Opens a menu to choose your CC, Band, Raster Mode Chan Sync, and then use Channel Raster to open a softkey menu:
Then Channel ARFCN, Center, or Offset
Else
then use Sync Raster, to open a softkey menu:
Then Sync ARFCN, Sync GSCN, Center, or Offset
For 5G TF and 5G NR EVM Conducted (instrument dependent). For more on 5G NR EVM Conducted, refer to “FieldFox EVM Measurements” on page 384.
4.Select Trace 6—choose:
—Window 1 2 3 4
— Then Win State OFF ON to ON
— Then Display Type
—Table or
—Bar Chart or
—Spectrum or
—Strip Chart
| The Spectrum view in 5G TF uses a center frequency that is +2.6 MHz offset from the carrier’s center frequency. This is done so that FieldFox can capture the necessary xPBCH (physical broadcast channel) information to demodulate the signal. Be aware that all of the instrument’s displayed numbers are rounded to three significant digits (e.g., 5.0026 GHz is displayed as 5.003 GHz). |
— Then CC (select component carriers)
—All (Not applicable for Spectrum. When All is specified, for Spectrum, the FieldFox Defaults == CC0) or
—CC0, CC1, CC2, CC3, or CC4 (i.e., 5G TF and 5G NR has up to seven component carrier choices).
— Then PCI All (select PCIs)
—All (Not applicable for Spectrum. When All is specified, for Spectrum, PCI is set to single). For all other display types, the results for any cells with any PCI are displayed (Default == All).
—Single displays the results for the selected PCI.
Repeat process as needed for additional Windows, Data, and CC settings. IMPORTANT! When you select multiple CCs (e.g., CC0, CC1, etcetera) and record data, you may actually see other cell signals that do not have sufficient power to be displayed, but are still detectable. When you select ALL, multiple component carriers are selected, but the results of the component carrier (CC) with the highest power is displayed. Refer to Figure 13-17 on page 399.
5.Optional: Press Sweep 3 and modify/select items:
—Single
—Continuous OFF ON to ON (Default)
—Restart
—Strip Points
—Log Meas Status OFF ON
6.Press Trigger Settings
—Freerun (Default) or
—External sets a sweep to trigger on an external TTL signal at the External Trigger connector. External trigger is available only after initial setting.
—Periodic sets a trigger that repeats at the period rate entered. Periodic trigger's phase can be altered by the Offset value.
7.Optional: Press Meas Setup 4 – LTE FDD, LTE TDD, and 5G TF softkeys are only required if scan does not display data.
—LTE FDD and LTE TDD: Press FreqError Th and change to 5 kHz – Wait a few seconds until Table populates or set FreqLock Range to Extended.
—Then change back to the desired Frequency Error Threshold for your measurement.
—5G TF: Press SyncCorr Th and change to 0% – wait a few seconds until the Table populates and
—Then change back to the desired Sync Correlation Threshold for your measurement.
—5G NR: Press FreqError Th and change to 7.5 kHz (Default)– Wait a few seconds until the Table populates or set SCS, SSB Case, or Lmax values.
—Then press More
——Then SSB Offset Detection opens the SSB offset detection softkey menu):
Then SSB Offset Detection OFF ON Enables/disables the SSB Offset Detection (Default == OFF). Determines whether the measurement is a normal 5G NR measurement or an SSB offset measurement. When disabled, the measurement will be a normal 5G NR measurement. When enabled, the measurement will be an SSB offset measurement.
Then Bandwidth Sets the FR1 and FR2 bandwidth. FR1/FR2 active bandwidths are coupled to the currently selected SCS value.
Then Snap Sync Raster When enabled this softkey, determines whether or not the results from the SSB offset detection measurement are automatically snapped to the synchronization raster. When the results are snapped to the synchronization raster, the ARFCN / GSCN is included in the results.
Then Results -> Setup opens a menu of SSB offset copy-related softkeys of to copy the selected SSB offset, and SSB Freq to the selected component carrier(s) center frequency.
Then choose:
CC ALL | Selects the active SSB offset component carriers for copying SSB offset or SSB frequency information (CC0 to CC7 or All). |
Copy SSB Offset | Copies the SSB offset result values to the selected component carriers (CCs). |
Copy SSB Freq | Copies the SSB frequency result values to the selected component carriers (CCs). |
——Then LTE Coexistence (NSA / DSS) opens the LTE Coexistence softkey menu):
Then NSA / DSS OFF ON Enables/disables the NSA /DSS feature and softkeys (Default == OFF). Determines whether the measurement is a normal 5G NR measurement or an NSA / DSS measurement. When disabled, the measurement will be a normal 5G NR measurement. When enabled, the measurement will be an LTE Coexistence measurement.
Then LTE Duplex Mode FDD TDD Selects the type of LTE signal to be used in the LTE Coexistence measurement (LTE FDD or TDD). Default == FDD.
Then CC All Selects the which component carriers are used in the measurement (CC0 to CC7). Default == All.
Then Display Type Table Bar Selects how the data is displayed (Table or Bar). Default == All.
Then LTE Setup opens a menu of softkey menu choices to set the 5G NR signal values (Freq/Dist, Meas Setup, and Trace. For details on these softkey menus, refer to the hardkey descriptions and their related softkeys in steps 5, 6, 7, and 11.
Then 5G NR Setup opens a menu of softkey menu choices to set the LTE signal values (Freq/Dist, Meas Setup, and Trace. For details on these softkey menus, refer to the hardkey descriptions and their related softkeys in steps 5, 6, 7, and 11.
——Then EMF opens the EMF softkey menu (See also, “How to Set Up EMF Mode Settings (Requires EMF (Option 358) and LTE FDD (Option 370), or LTE TDD (Option 371), or 5G NR (Option 378))” on page 420):
Then EMF Meas OFF ON Enables/disables EMF measurements (Default == OFF).
Then EMF Triaxial [Sum All] ON Sets the axis (X, Y, or Z) or axes (Sum All) of the triaxial antenna to be used in the EMF measurements (Default == Sum All).
Then EMF Units dBuV/m Sets the EMF units (dBuV/m)
——Then Advanced opens the advanced softkey menu:
Then Capture Length Sets the length in frames for the current scan 4, 8, 16 24, 32, or 40 frames are the choices (Default == 4 Frames).
Then Drive Speed Sets the scan rate. Choices are Low, Medium, or High (Default == Low). Use slower speeds higher-mobility cases to track faster changes in channel.
Then Phase Comp OFF ON Enables/disables the phase compensation to compensate for phase differences between symbols during the upconversion or downconversion.
Then SS Meas DMRS OFF ON Enables/disables the current synchronized signal’s demodulation reference signal.
8.Press Trace 6
—And, set up your Windows and component carriers (CCs) as indicated in “How to Set Up Over–the–Air (OTA) Mode Settings” on page 385.
9.Press System
—Press GNSS > GNSS Receiver > Internal > Esc
—Press System > FrequencyRef > Internal > Back IMPORTANT! It is not sufficient to be locked to the GNSS satellite, the frequency reference must be locked to GPS
Select one of the following display orientations:
—Press Trace 6—choose:
—Table or
—Bar Chart or
—Spectrum or
—Strip Chart or
Figure 13-24 Table and Bar Chart Display Types – LTE FDD – (LTE TDD is similar)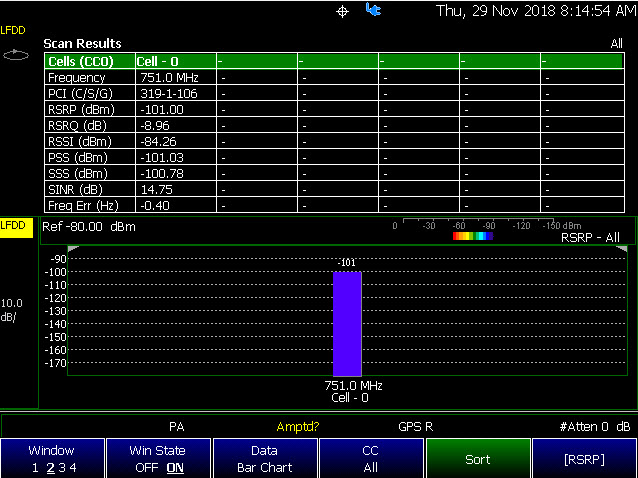
Figure 13-25 Spectrum and Strip Chart Display Type – 5G TF 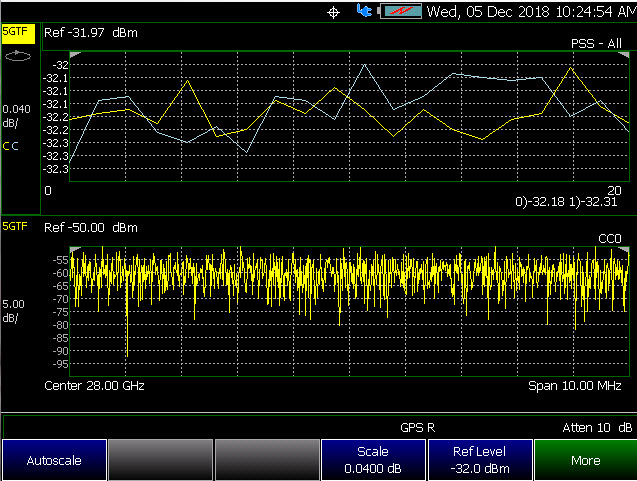
Figure 13-26 Spectrum and Table Type (SSB Offset Detection Softkeys) – 5G NR
Step 3. Modify Scale and the Display Color Bar Settings
To assign colors to low and high power values:
1.Press Scale/Amptd > Red Limit to set high power values and to set the color.
2.Press Blue Limit to set low power values and to set the color.
3.And, then press System > Display > Display Colors, to set Indoor, Outdoor, or other display colors. See also Chapter 31, “System Settings.”
Figure 13-27 Outdoor Display Colors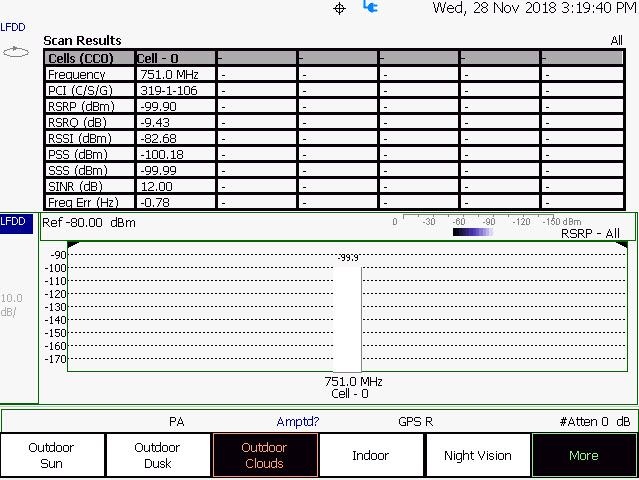
Figure 13-28 Indoor Display Colors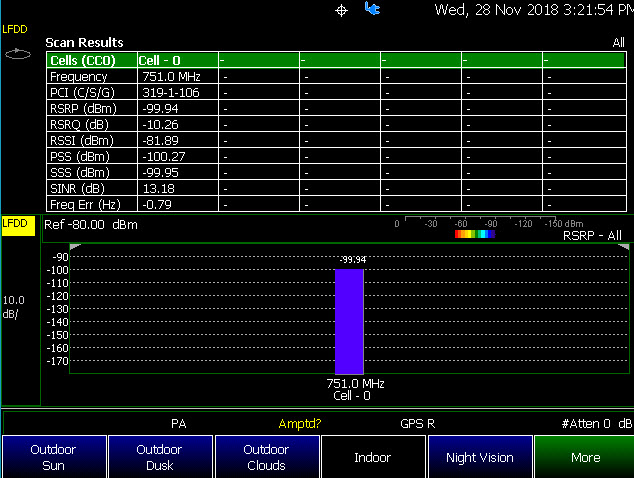
Step 4: Enable Data Logging and Playback the Results
| Spectrum and Strip Chart information is not recorded. Only the Table and Bar Chart data are saved. See “How to Record a Data Log Procedure” on page 429. |
Data Logging creates a record of your data with a timestamp and GPS stamp (refer to “GNSS (GPS+) and GPS” on page 886). GPS must be enabled for the log results to include a GPS stamp or use Preferences to enable the timestamp. Refer to Chapter 31, “System Settings.”
Features
—Log files contain cell results for different component carriers (CCs) including timestamps and/or distance stamps.
—Timestamps are included in log files with or without GPS.
—GPS must be enabled for log altitude results.
See also “GNSS (GPS+) and GPS” on page 886.
—Data results can be logged
—Data results can be saved to a *.CSV or *.KML file. Refer to “Save 5: Save the Log Results:” on page 417.
—User specifies how often results are stored.
—Time: Store results every “n” seconds
—Altitude: Store results every “n” meters. GPS must be enabled to store results by altitude.
Procedure
1.Press Trace 6 > More > Data Logging to view the Data Logging softkeys and set the Record Settings, Record Save/Recall, and Indoor Map Data Logging
—Record (Outdoor Logging) or
—Play (If you have previously stored data recordings.)
a.Outdoor Mapping only: To set the Record Settings—choose:
—Meas Interval
—Interval Time
—Time Interval or
—Distance Interval
b.Then press Record Save/Recall
—Then File Folder Default System
—Default – Sets the default User Folder path:
——List files (*.csv and *.kml) are save-recalled to: "[CurrentDevice]:\RecordPlayback\OTA\"
——Data Log-Play files are save-recalled to: "[CurrentDevice]:\RecordPlayback\OTA\"
Or
—System – Sets the User Folder to the user defined system folder path/name:
——List files are save to-from "CurrentDevice\<UserSelectedFolder>\"
——Data Log-Play files are save-recalled to: "CurrentDevice\<UserSelectedFolder>\"
Refer to “File Management” on page 913.
—Then File Type
— KML (Default) or
—CSV
—Then Save Log File.
or
—Then Recall Log File.
—Auto Save OFF ON - (Default == OFF) Press to toggle to ON to enable Auto Save.
—Then Back
c.Optional: Press Indoor Map Data Logging then
— Record Indoor Data or Recall Indoor Log File. Refer to “How to Use Data Logging (OTA Options 370, 371, and 378)” on page 428.
Learn more, refer to Chapter 16 Mapping and “Option 352 Indoor Maps Setup Procedure” on page 515 and “Setting up Data Logging” on page 527.
2.Press Back to return to previous menu.
3.Outdoor Mapping: Press Record to begin a new recording and then
—Then Maps To enable map view and related features (e.g., Data Selection, Red/Blue Limits, Labels & Icons, Zoom).
— View Map OFF ON Displays the current GPS location.
—Data Selection Opens a softkey menu to set the active data channel, sort type, and sort order. See also previous step 8 in “How to Set Up Over–the–Air (OTA) Mode Settings” on page 385.
—Red/Blue Limits Opens a softkey menu to assign power values to the red (high power limits) and blue (low power limits) heat map display limits (Defaults: Red Limit == –20 dBm, Blue limit == –90 dBm).
—Labels & Icons Opens a softkey menu to enable/disable map data point labels and icon types.
Labels OFF ON | Enables/Disables map data point labels. When enabled, a label is displayed for every map data point (e.g., “Data 1”). When disabled, labels are not displayed for the map data points. |
Icons | Sets the type of icon that is used to display a map’s data points (Default == Flag). |
— Save Image (PNG) Saves the current displayed map to a *.png file (default filename is “Pilgrimage”).
4.When done press Stop. The log file is automatically saved to the defined Device Type and File Type (i.e., when you press Done).
Else, edit the file name, and then press Done.
See also, Chapter 16 Mapping and “Setting up Data Logging” on page 527.
Learn more about file settings, refer to Chapter 33, “File Management.”. |
5.Press Back
Playing a Data Log and Viewing the Data
To play the log results:
1.Press Record Save/Recall > Recall Log File
And, use the Use the RPG or the arrow keys to highlight the file to be played.
2.Press Recall File > Back > Play
3.Optional: Press Scale/Ampltd
Then choose:
—Optional (Bar Chart and Spectrum only): To adjust the following, use the RPG (fine adjust) or the arrow keys (coarse adjust) to change the color bar.
—Autoscale to have the FieldFox optimize the scale for the current measurement.
—Ref Pos to change the reference line position (0 to 10).
—Scale to change the reference line position (0.01 to 100 dB).
—Ref Level to change the top reference position in the Bar Chart, Strip Chart, and Spectrum.
—Red Limit to change the red color high power value (dBm). Bar chart only.
—Blue Limit to change the blue color low power value (dBm). Bar chart only.
4.Press Stop to exit the log playing.
To pause the log play:
1.Press Pause Resume to pause or resume the log playing.
2.Press Stop to exit the log playing.
Learn more, refer to Chapter 16 Mapping and “Setting up Data Logging” on page 527.
Two file types are supported for save or recall log results:
—KML file format
—Files stored in this format can be imported into 3rd party applications like Google Earth or Google Maps.
—CSV file format. Files stored into this format can be imported into spreadsheet applications.
Procedure:
1.Press When done press Stop. Immediately stops recording and a “Save the Log File” menu opens to rename and save your data log file.
Record-Play files are saved to: —If File Folder is set to Default then Record-Play files are save-recalled to: "[CurrentDevice]\RecordPlayback\[Current mode]\" —If File Folders are set to System, then Record-Play files are save-recalled to: "CurrentDevice\<UserSelectedFolder>\ |
2.In the “Save the log file” window that opens, optionally change the name of the default file displayed, else press Done.
Saves the file and exits the current softkey menu.
3.‘To begin recording: Press Record
4.When done press Stop. The file is automatically saved to the defined Device Type and File Type.
Else, edit the file name and folder path, under Record Save/Recall > File Folder where the file results will be stored.
Learn more about file settings, refer to Chapter 33, “File Management.”. |
5.Press Back
Learn more, refer to Chapter 16 Mapping and “Setting up Data Logging” on page 527.
Step 6: Import and Play back KML Files into 3rd Party Software (Example: Google Earth with Animation Tool)
Features
Use the Playback Slider to replay measurement results. See also Google Maps and or Google Earth’s help.
—Open the FieldFox *.KML file in Google Earth. Time Slider appears in upper left of the map.
—Manual mode – Move the time slider cursor to see color-coded icons pop-up according to the timestamp.
—Loop mode has a Fast-Slow Replay Option.
—Click on each color coded balloon to see the table of measurement results for that location.
Figure 13-29 Importing a KML File Into Google Earth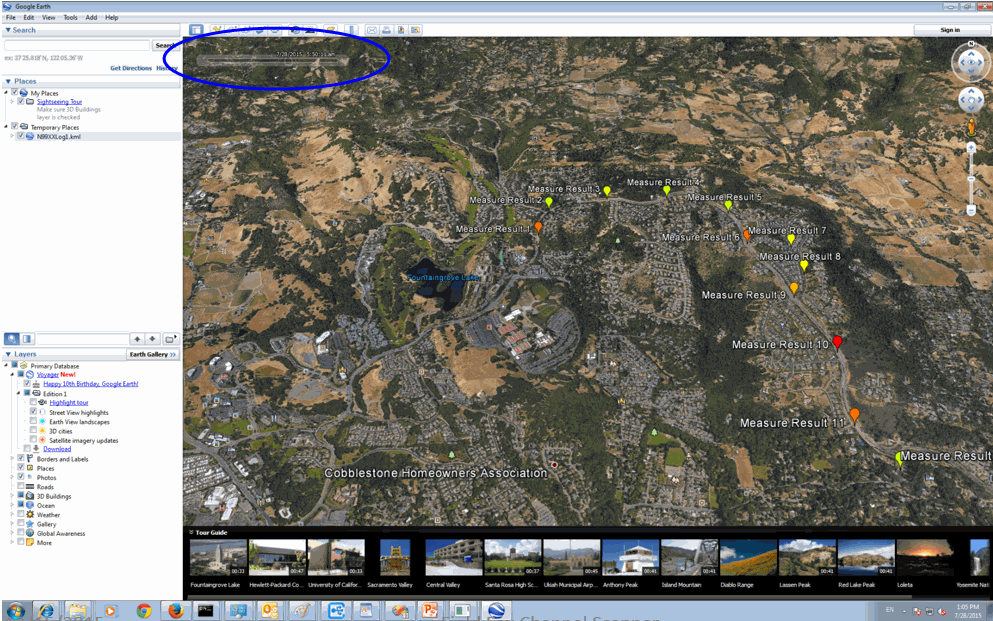
How to Set Up EMF Mode Settings (Requires EMF (Option 358) and LTE FDD (Option 370), or LTE TDD (Option 371), or 5G NR (Option 378)) If OTA or SA mode does not detect an EMF Option 358 license, then the EMF application and the EMF antenna’s axes must be set up manually. This use model is not recommended or supported by Keysight. The EMF antenna’s cable loss is not included, in the antenna’s correction factors. For an accurate EMF measurement, the cable loss values should be accounted for. Refer to “EMF Setup Procedure” on page 245. IMPORTANT! The EMF antenna, ARIA6000 or FSH3D or equivalent—is required for EMF measurements. Refer to Chapter 15, “USB Antennas – Full Capability Requires EMF Option 358, and either SA mode (Option 233 Mixed Analyzers) or OTA—LTE FDD (Option 370), LTE TDD (Option 371), 5G NR / 5G NR EVM Conducted / 5G TF (Option 378).”. The antenna operation for single-polarization measurements is different between ARIA6000 and FSH3D. Please consult the datasheet corresponding to each antenna for specific details.
EMF mode measures signals at the SA RF Input Port 2 connector.
EMF mode requires the FieldFox to have SA mode (Option 233 on combination analyzers), LTE FDD (Option 370), LTE TDD (Option 371), or 5G NR (Option 378), and CPU2 installed.
Recommended, but not required, preamplifier (Option 235) to improve receiver sensitivity.
With Option 358 (EMF), network designers can measure and verity the RF exposure compliance as required by each country.
This section reviews the steps in setting up an EMF measurement, using a EMF antenna. If you are not familiar with this process or would like more information, refer to Chapter 15, “USB Antennas – Full Capability Requires EMF Option 358, and either SA mode (Option 233 Mixed Analyzers) or OTA—LTE FDD (Option 370), LTE TDD (Option 371), 5G NR / 5G NR EVM Conducted / 5G TF (Option 378).”
This section consists of:
EMF has the following features:
EMF Measurement Results:
—Measure and display corrected field strength in RMS average power
—Antenna control over X, Y, and Z antenna factors downloaded via USB for ARIA6000 antenna or import a CSV file for FSH3D antenna
—Pass/Fail limit testing supported
—External PC not required
EMF uses the following data formats:
—Field Strength units:
—dBµV/m – For use with E-field signals
—dBµA/m – For use with H-field signals
—dBG – dB Gauss
—dBpT - dB Tesla
Figure 13-30 Example of EMF with Triaxial Antenna
EMF Setup Procedure When the EMF antenna correction factors are imported, EMF (Option 358) couples many settings to ease setting up the EMF measurement (e.g., Apply Corrections is enabled, all X, Y, and Z antenna axes are enabled, and Amp Corr Select is set to ARIA6000 or FSH3D Triaxial XYZ). IMPORTANT! The softkey menu selection and display of Axis X, Y, Z, corresponds to Loop 1, 2, 3, respectively for EMF antenna FSH3D.
1.Setup the FieldFox Spectrum Analyzer for a Channel Power measurement.
a.Press Mode > OTA >
Press Measure 1 then one of the following:
—LTE FDD
—LTE TDD
—5G TF
—5G NR
—5G NR EVM Conducted
| If necessary, this step can be skipped and done after the EMF antenna is set up. |
2.Connect the EMF antenna to the SA RF Input, port 2 and to a FieldFox USB port. See also, Chapter 15, “USB Antennas – Full Capability Requires EMF Option 358, and either SA mode (Option 233 Mixed Analyzers) or OTA—LTE FDD (Option 370), LTE TDD (Option 371), 5G NR / 5G NR EVM Conducted / 5G TF (Option 378)” and to Chapter Figure 15-1, “FieldFox With EMF Antenna”.
| Only Agos Advanced Technologies ARIA6000 and Schwarzbeck Mess-Elektronik FSH3D Triaxial Isotropic EMF antenna is currently compatible with EMF (Option 358). See also Chapter 9, “SA (Spectrum Analyzer) Mode (Option 233–Mixed Analyzers)”. |
3.Importing and selecting X/Y/Z antenna factors:
a.Press System > Utilities > EMF Antennas
—For ARIA6000 EMF antenna, press Antenna Select and select "ARIA6000".
Then press Import Antenna – to import the antenna factors from the antenna’s memory over the USB connection (this may take 5 seconds or so and vary with the triaxial antenna). The Import Antenna softkey menu is only activated when Antenna Select is set to ARIA6000 or FSH3D. If the antenna factor import is successful, the FieldFox displays: “Success: Antenna Factors Imported: EMF Antenna ID: ->[R] Antenna ID: ARIA6000-1006 ->[]“. The last 4-digits will vary for each antenna (i.e., “1006” value will vary). If the FieldFox displays this error Error: EMF antenna Error: Not found or Unable to communicate with antenna. Ensure it is connected. is displayed, verify the EMF antenna is connected correctly. See also “Troubleshooting” on page 437.
—For FSH3D EMF antenna, press Antenna Select and select "FSH3D".
Then press Import Antenna > Import Files - to import FSH3D antenna factor CSV file from external storage device e.g. USB or SD Card to the INTERNAL storage. Recall File to retrieve these imported CSV files directly from INTERNAL when necessary.
Figure 13-31 FSH3D antenna factor CSV Import Files storage device selection Softkey 
Press the storage device containing FSH3D antenna factor CSV file you wish to import from. The window will navigate to the chosen storage device and display all available CSV files.
Choose a single FSH3D antenna factor CSV file from the list, then press Import.Once imported, press Done to complete the process.
To recall INTERNAL FSH3D antenna factor CSV, press Import Antenna, then select the target CSV file and press Recall File.
| FSH3D antenna factor CSV files MUST be saved in the "AntennaEMF" folder within the storage device to import from. |
—By selecting Antenna Select and choosing either ARIA6000 or FSH3D to verify the EMF antenna selected (Default == Manual). Only compatible EMF antennas can be used for EMF measurements.
See also, “How to Use the Manual EMF Channel Power” on page 250.
—Optional: Press Antenna Axis the antenna axis should be set to Auto for default operation. When AUTO is selected the application (e.g., Channel Power or OTA) controls the axes and switches as needed. With the AUTO setting, all antenna elements (X, Y, and Z) are OFF. The Antenna Axis softkey is only activated when Antenna Select is set to ARIA6000 or FSH3D.
—Press Back > Back to exit the EMF Antenna softkey menu.
4.Modifying the EMF settings:
Press Meas Setup 4
—Then More > EMF then
— EMF Meas OFF ON disable/enable the EMF measurement (Default == OFF).
— EMF TriAxial [Sum All] Sets the axis (X, Y, or Z) or axes (Sum All) of the triAxial antenna to be used in the EMF measurements (Default == Sum All).
— EMF Units Choose dBuV/m (Default) or V/m.
— Extrap Factor Enter positive value in dB (Default == 0.00, Maximum ==1000.00). Learn more about Extrapolation Factor in “Using Extrapolation Factor” on page 754
—Back to exit to the previous softkey menu.
For more details on editing the EMF antenna, refer to Chapter 15, “USB Antennas – Full Capability Requires EMF Option 358, and either SA mode (Option 233 Mixed Analyzers) or OTA—LTE FDD (Option 370), LTE TDD (Option 371), 5G NR / 5G NR EVM Conducted / 5G TF (Option 378).”
5.Once you have finished with your EMF antenna setup:
a.Press Sweep 3 > Single > Restart
The FieldFox should display in order Analyzing CCO X-Axis, Analyzing CCO Y-Axis, and Analyzing CCO X-Axis and then do a square root sum of the X, Y, and Z measurement values in the FieldFox. Multi-cell measurements are done similarly for each cell ID (i.e., Cell CC0 to CCn). Refer to Figure 13-32 on page 426.
b.Verify OTA 5G NR X, Y, and Z Axes Factors in SA mode (e.g., 3.5 GHz signal)). Refer to Figure 13-33 on page 427.
i.Press Mode > SA then
ii.Press Freq/Dist > Center > 3.5 GHz then
iii.Press Freq Span > 120 GHz then
iv.Press System > Utilities > EMF Antennas > Antenna Axis [Auto] – (Default == Auto) then
v.Press X to view the X axis
vi.Press Y to view the Y axis and
vii.Press Z to view the Z axis
6.Verify EMF in 5G NR mode:
a.Press Mode > OTA > 5G NR then
b.Press Meas Setup 4 > More > EMF > dBuV/m
(i.e., For this example. Other units are selectable.)
For more information:
—Refer to Figure 13-32 on page 426.
—See also “GNSS (GPS+) and GPS” on page 886.
Figure 13-32 Example Summing of Triaxial Values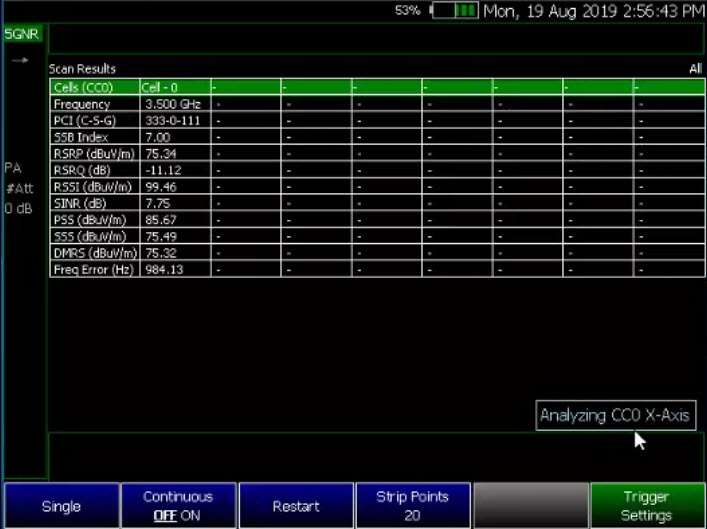
Figure 13-33 Using SA Mode (Example) to Verify the Triaxial Values – Axis Y is Displayed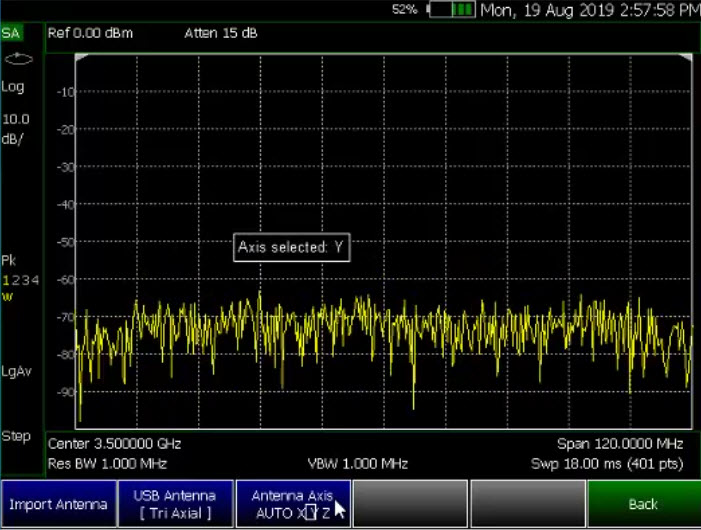
How to Use Data Logging (OTA Options 370, 371, and 378)
| Spectrum and Strip Chart information is not recorded. Only the Table data is saved. See “How to Record a Data Log Procedure” on page 429. |
| While the Record/Play softkey is displayed in all measurements, Record/Play only logs and plays back Table and Bar Chart data. See “How to Record a Data Log Procedure” on page 429. |
Data Log-Play files are saved to: —If File Folder is set to Default then Data Log-Play files are save-recalled to: "[CurrentDevice]\RecordPlayback\OTA". —If File Folders are set to System, then Data Log-Play files are save-recalled to: "CurrentDevice\<UserSelectedFolder>\". |
Data Logging allows you to record OTA trace data and play them back at a later time. Use this feature to monitor table data activity over a period of time.
Data logs can be saved to the FieldFox Internal memory, an SD Card, or a USB flash drive.
This section assumes you have already completed the initial setup and have either an LTE FDD, LTE TDD cell, or 5G TF setup displayed on the FieldFox.
During a record or playback session, the following is displayed in the top-center area of the screen:
— Rec: 55/55 2018-12-31 03:26:11 PM
where:
—55/55 is the current and total trace number: currently trace is 55 of 55 total scans.
—2018-12-3103:26:11 PM is the date and time of recording.
—The name of a recording can be changed using Manage Sessions. Learn more in “To change Data Logging Configuration settings:” on page 430.
See also Chapter 31, “System Settings.”
When GPS is enabled , GPS R is indicated at the bottom of the FieldFox display. Learn more in “GNSS (GPS+) and GPS” on page 886.
| If Data Logging or Playback is not occurring when you think it should, check the following: —Is the sweep in HOLD? (upper-left annotation), or check the Sweep menu for Continuous set to OFF. —Is Recording or Playback Paused? (mid-left annotation). —Is the Data Logging or Playback Interval set too long? (Configuration settings). |
How to Record a Data Log Procedure Data Log-Play files are saved to: —If File Folder is set to Default then Data Log-Play files are save-recalled to: "[CurrentDevice]\RecordPlayback\OTA". —If File Folders are set to System, then Data Log-Play files are save-recalled to: "CurrentDevice\<UserSelectedFolder>\".
—Press Trace 6 > More > Data Logging >
—Then for Outdoor Logging, press Record
is displayed in the left of screen graticules.
During recording, choose from the following:
—Pause Resume Temporarily halts recording until pressed again. The incoming trace continues to sweep. Press again to continue recording. See also “How to Play a Data Log” on page 431.
—Stop Immediately stops recording and opens a menu to name/rename and save your data log. For more, refer to “How to use the FieldFox labeler ” on page 916.
—Record Settings (Outdoor Mapping only) opens a softkey menu to enable you change your record related settings. For more, refer to “To change Data Logging Configuration settings:” on page 430.
—Recall Save/Recall opens a softkey menu to enable you to save and recall your data log and related file settings. For more, refer to “To change Data Logging Configuration settings:” on page 430.
Learn more, refer to Chapter 16 Mapping and “Setting up Data Logging” on page 527
To change Data Logging Configuration settings:
1.Press Trace 6 > More > Data Logging
2.Then choose from the following:
a.To set the Record Settings (Outdoor Mapping only)—choose:
—Meas Interval OFF ON Enable to make the measurement interval softkeys active (Default == OFF).
—Interval Type Choose: Time or Distance
—If applicable, Time Interval Enter time in seconds (1s to 3.6 ks) or
—If applicable, Distance Interval Enter time in miters (10m to 10 km)
b.To set the Record Save/Recall
—File Folder Default System
—Default – Sets the default User Folder path:
——List files (*.csv and *.kml) are save-recalled to: "[CurrentDevice]:\RecordPlayback\CS\"
——Data Log-Play files are save-recalled to: "[CurrentDevice]:\RecordPlayback\CS\"
Or
—System – Sets the User Folder to the user defined system folder path/name:
——List files are save to-from "CurrentDevice\<UserSelectedFolder>\"
——Data Log-Play files are save-recalled to: "CurrentDevice\<UserSelectedFolder>\"
Refer to “File Management” on page 913.
—Then File Type
— KML (Default) or
—CSV
—Then Save Log File.
or
—Then, Recall Log File
—Auto Save (Default == OFF)
—Then Back
c.Optional: Press Indoor Map Data Logging then
— Record Indoor Data or Recall Indoor Log File. Learn more, refer to Chapter 16 Mapping and “Option 352 Indoor Maps Setup Procedure” on page 515.
—Then choose Navigate OFF ON, Data Selection, Zoom, Pan, Record Data, More
Learn more, refer to Chapter 16 Mapping and “Setting up Data Logging” on page 527. See also, Chapter 33, “File Management.”
—Press Trace 6
—If the session is already open, skip the following step. Otherwise:
—Then More > Data Logging > Playback
—Then Recall Log File
If these are large recordings on a device, it could take several seconds for the FieldFox to display the list. |
——Then Recall File
—Then Play to playback your Table data.
 is displayed in the left of screen graticules during playback. When the end of the recording is reached, playback begins again at trace 1 and continues to loop indefinitely.
During playback, choose from the following:
—Pause Resume Temporarily halts playback. Then choose from the following:
—Pause Resume Press to continue playing.
—Stop Immediately stops playback. Then choose from the following:
—Play Start playback from trace 1.
—Recall Log File Opens a list of stored data files.
Select a file to playback.
—Recall File
—Back
—PlayTrace ID Auto resume playing by selecting a trace number to playback between 1 and the record length (MAXimum == 2000 (multiple CC) and 1000 (single CC)).
Other Features Available
—Alignments - For information on using alignments, refer to the SA chapter’s section, “Alignments” on page 219.
—Scale Settings – For information on using scale settings, refer to the Data Analysis chapter’s section, “All about Scale Settings” on page 852 (not all settings apply to OTA Options 370).
—External Gain - Refer to refer to the SA chapter’s section, “External Gain” on page 166.
Executing an auto-range, which determines the optimal RF attenuation and preamp settings for the current input signal.
See also, “OTA Setup Procedure” on page 385.
Couplings: The current measurement settings help determine the auto-range parameters. If more than one CC is enabled when an auto-range is executed, the range is determined for each CC separately and the final range setting is set using the maximum.
| Executing an auto-range sets the Range, RF Attenuator, and Preamp settings. Executing an auto-range does NOT change any of the display settings (Ref Level, Scale or Ref Pos). |
Figure 13-34 OTA 5G NR Signal Before Auto-Range – Table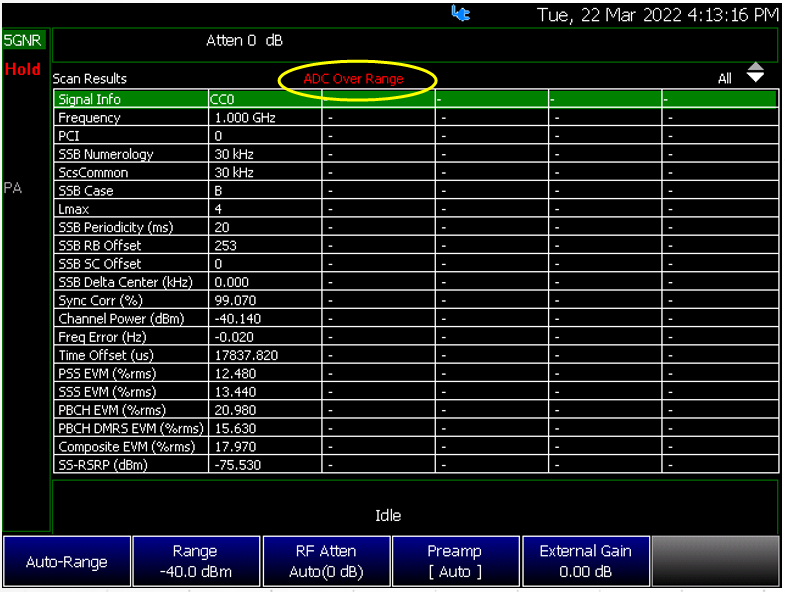
Figure 13-35 OTA 5G NR Signal Before Auto-Range – Spectrum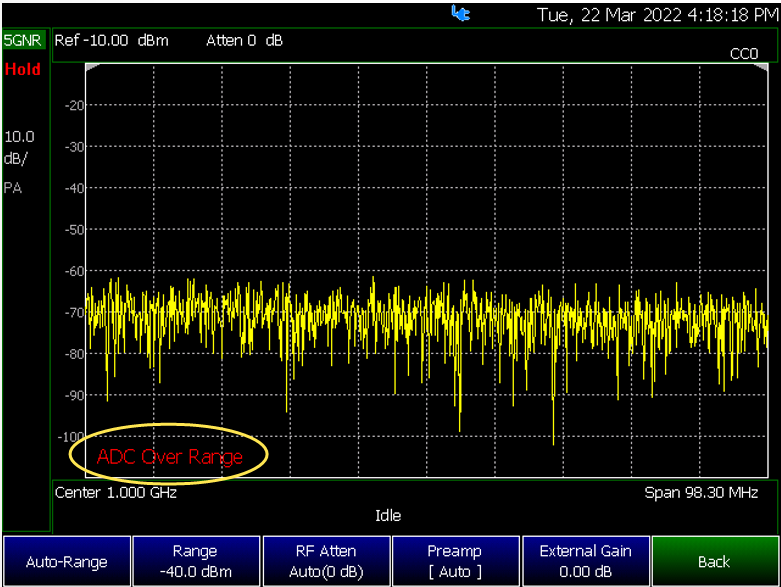
Figure 13-36 OTA 5G NR Before Auto-Range – Windows State ON
Figure 13-37 OTA 5G NR Ongoing Auto-Range – Performing Auto-Range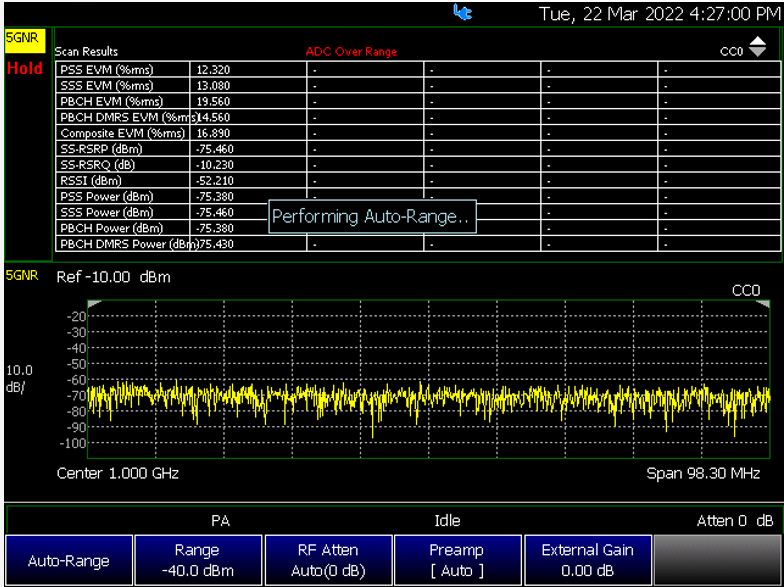
Figure 13-38 OTA 5G NR After Auto-Range, but RF Atten or Preamp Settings Changed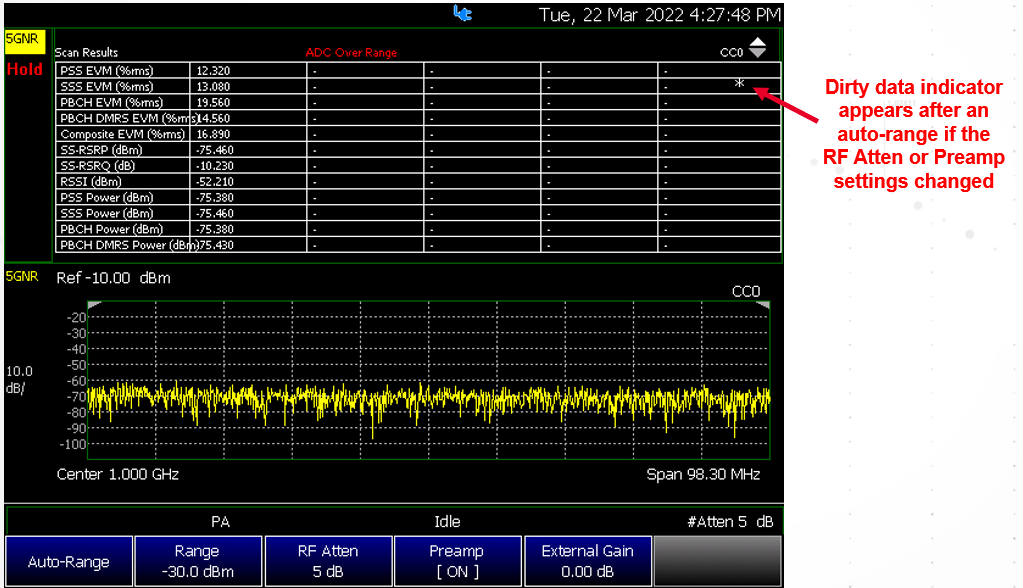
Figure 13-39 OTA 5G NR After Auto-Range and Clean Sweep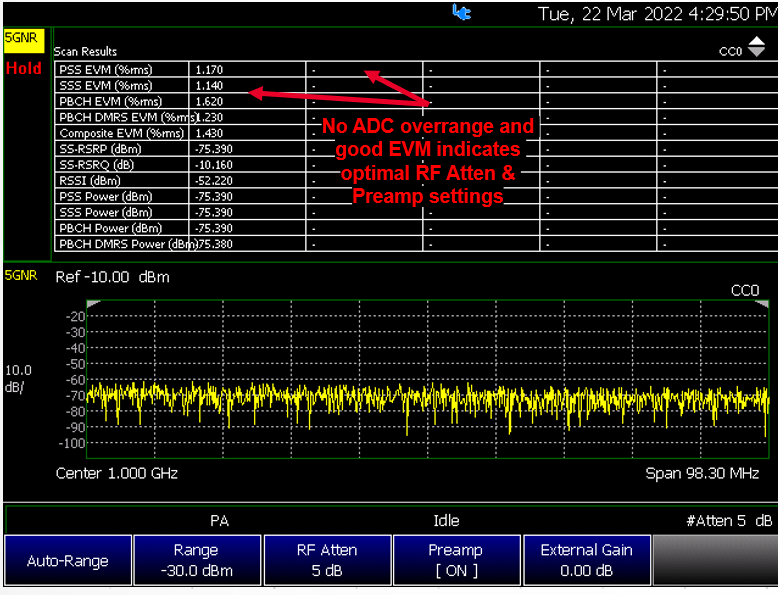
If your OTA setup is not behaving as expected:
—Verify setup is correct by referring to “How to Set Up Over–the–Air (OTA) Mode Settings” on page 385.
—Attenuator set to 0 dB
—Preamplifier set to ON
—Correct Band, Channel, and Center Frequency entered
—GNSS set to Internal
—Frequency Ref set to GPS
—For LTE FDD and LTE TDD: Verify that the Frequency Error Threshold (dB)—(FreqError Th) value is large enough or not too large
—For LTE FDD and LTE TDD: Verify that the Extend Freq Lock value is enabled and then adjust settings to improve your measurement
—. For 5G TF: Check that the Frequency Correction Threshold value (%)— (Sync Corr Th %) is small enough or not too large.
—ADC errors: Use Scale/Amptd > Range to adjust the absolute power level (dBm).
For some data views, you need to press More to view the Range softkey.
—No data displayed: Press Meas Setup 4 – Only required if scan does not display data.
——LTE FDD and LTE TDD: Press FreqError Th and change to 5 kHz – Wait a few seconds until table populates or set FreqLock Range to Extended.
——Then change back to the desired Frequency Error Threshold for your measurement.
——5G TF: Press SyncCorr Th and change to 0% – wait a few seconds until the Table populates and
——Then change back to the desired Sync Correlation Threshold for your measurement.
This section provides a description of some of the terms used in the FieldFox’s OTA mode.
Abbreviation | Description |
|---|---|
LTE FDD & | |
Center Frequency | The specified LTE FDD carrier center frequency. |
C/S/G | Physical Cell information (PCI), or Cell ID – C/ S /G |
Cell ID (PCI) | Physical cell ID – The Primary Sync Signal and Secondary Sync Signal largely define the PCI. PCI is also referred to sometimes as Cell ID. |
PSS | PSS (dBm) is the Primary Synchronization signal for an LTE downlink frame. |
RSRP | Reference Symbol Received Power (dBm) |
RSRQ | Reference Signal Received Quality (dBm) |
RSSI | Reference Signal Strength Indicator (dBm) |
SINR | Signal to Interference & Noise Ratio (dB) |
SSS | SSS is the Secondary Synchronization signal for an LTE downlink frame (dBm). |
Freq Error Th | LTE FDD and LTE TDD Frequency Error Threshold (Hz). Any data that is does not meet the defined Frequency Error value, is not displayed. |
5G TF | |
Center Frequency | The specified 5G TF carrier center frequency. |
Cell ID (PCI) | Physical cell ID – The Primary Sync Signal and Secondary Sync Signal largely define the PCI. PCI is also referred to sometimes as Cell ID. |
Power | (Channel Power) (dBm) |
PSS | PSS (dBm) is the Primary Synchronization signal for an LTE downlink frame. |
SSS | SSS is the Secondary Synchronization signal for an 5G TF downlink frame (dBm). |
SyncCorr Th | 5G TF Synchronization Correlation Threshold (%). Any data with errors that are less than the Synchronization Correlation Threshold (%) are not displayed. |
5G NR | |
Center Frequency | The specified 5G NR carrier center frequency. |
Cell ID (PCI (C-S-G)) | Physical cell ID – The Primary Sync Signal and Secondary Sync Signal largely define the PCI. PCI is also referred to sometimes as Cell ID. |
SSB Index (dBm) | Synchronization Signal Block Index |
SS-RSRP /RSRP (dBm) | Synchronization Signal Reference Signal Received Power – The linear average over the power contributions (in [W]) of the resource elements that carry cell-specific reference signals within the considered measurement frequency bandwidth. For RSRP determination the cell-specific reference signals R0 according TS 36.211 [3] shall be used. If the UE can reliably detect that R1 is available it may use R1 in addition to R0 to determine RSRP. The reference point for the RSRP shall be the antenna connector of the UE. |
SS-RSRQ /RSRQ (dB) | Synchronization Signal Reference Signal Received Quality |
RSSI (dBm) | Received Signal Strength Indicator measures the average received power found only in OFDM symbols that for an antenna port that are part of the measurement bandwidth over N resource blocks. |
SS-SINR /SINR (dB) | Synchronization Signal-to-Noise and Interference Ratio – Reference Signal to interference and noise ratio – indicates the values measured over the same bandwidth and normalized to one subcarrier bandwidth. |
PSS (dBm) | PSS (dBm) is the Primary Synchronization signal for a 5G NR frame. |
SSS (dBm) | SSS is the Secondary Synchronization signal for a 5G NR downlink frame (dBm). |
DMRS (dBm) | Physical Broadcast Channel Demodulation Reference Signal (dBm). Used by 5G NR receiver to produce channel estimates for demodulation of associated physical channel. |
Freq Error (Hz) | Frequency error is the difference of the transmitted signal quality from the ideal (Hz). |
Chan Freq | Chan Freq is the channel frequency, when SSB Offset Detection has been enabled. |
SSB Offset | Determines whether the measurement is a normal 5G NR measurement or an SSB offset measurement. When disabled, the measurement will be a normal 5G NR measurement; When enabled, the measurement will be an SSB offset measurement. The purpose of the SSB offset measurement is to measure the offset of the SSB from the current Center Frequency. Once you measure the SSB offset, you can use the results to update the Offset Frequency and make a normal 5G NR measurement. |
SSB Freq | This is the SSB center frequency (the offset of the SSB from the channel center frequency). |
ARFCN/GSCN | The synchronization raster ARFCN / GSCN associated with the SSB frequency (only displayed when Snap Sync Raster is enable). |
Time Offset (us) | Time offset is defined as the time difference between the NR frame boundary and the beginning of the capture. And, is meant to be used with a “frame trigger” (GPS synced periodic trigger when measuring base station OTA signals). The frame boundary closest to the beginning of the capture is always used for the measurement (NR signals are periodic; so a single capture contains multiple frame boundaries). |
5G NR EMF Conducted | |
Center Frequency | The specified 5G NR carrier center frequency. |
Cell ID (PCI) | Physical cell ID – The Primary Sync Signal and Secondary Sync Signal largely define the PCI. PCI is also referred to sometimes as Cell ID. |
SSB Numerology | Synchronization Signal Block (SSB) |
ScsCommon | Subcarrier spacing common (ScsCommon) |
SSB Case | Synchronization Signal Block Case (SSB Case) |
SSB Lmax | Synchronization Signal Block (SSB Lmax) is the maximum number of SSBs within a SSB. |
SSB Periodicity (ms) | Synchronization Signal Block Periodicity (SSB Periodicity (ms)) |
SSB RB Offset | Synchronization Signal Block Resource Block Offset (SB RB Offset) |
SSB SC Offset | Synchronization Signal Block (SSB SC Offset) |
SSB Delta Center (kHz) | Synchronization Signal Block Delta Center (SSB Delta Center (kHz)) |
Sync Corr (%) | Synchronization Correlation (Sync Corr (%)) |
Channel Power (dBm) | Channel power |
Freq Error (Hz) | Frequency error (Hz) |
Time Offset (ms) | Time Offset (ms) is one of the required EVM calculations. |
PSS EVM (%rms) | PSS EVM (%rms) is the Primary Synchronization signal for 5G NR EVM. |
SSS EVM (%rms) | SSS is the Secondary Synchronization signal for a 5G NR EVM (%rms). |
PBCH DMRS EVM (%rms) | Physical Broadcast Channel Demodulation Reference Signal for EVM (%rms). |
Composite EVM (%rms) | Composite EVM (%rms) analyzes the output of the combined signal from multiple transmit antennas. |
SS-RSRP (dBm) | Synchronization signal reference signal received power (SS -RSRP) is defined as the linear average over the power contributions (in [W]) of the resource elements that carry secondary synchronization signals (SS). |
SS-RSRQ (dB) | Synchronization signal reference signal received quality (SS -RSRQ) is defined as the ratio of N x SS-RSRP/NR carrier RSSI. Here N refers to number of resource blocks in NR carrier RSSI measurement Bandwidth. The measurements in N (Numerator) and D (Denominator) are made over the same set of resource blocks (RBs) |
RSSI (dBm) | Received Signal Strength Indicator measures the average received power found only in OFDM symbols that for an antenna port that are part of the measurement bandwidth over N resource blocks. |