Limit Lines
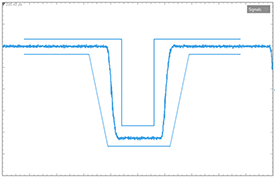
Limit lines are displayed boundaries used for pass/fail testing. Limit lines cannot be used in eye diagrams.
| Limit Lines |
|
Displaying Multiple Waveforms
Use the Stacked and Tab Tile content window toolbar buttons to make multiple-waveform limit tests easier to view. See Views and Panels.


Use the Limit Line Test Editor dialog box to create and run a limit-line test.
Choose Tools > Limit Line Test Editor to open this dialog box.
Choose Measure > Limit Line Test... to open and start using a limit line file.
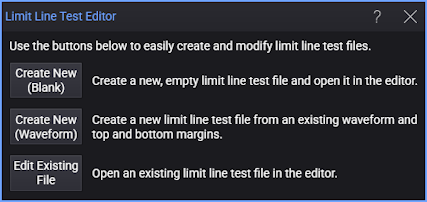
- Create New (Blank) — Click to open the Limit Line Details Editor with a new empty limit line. Use this dialog box to create a limit-lines test by individually defining points while viewing the limit line on the display. You can save your new limit-line definition to a file.
- Create New (Waveform) — Click to automatically create complex limit lines based on a displayed waveform using the Create Limit Line Test from Waveform dialog box. After creating your limit-line test, the Limit Line Details Editor is displayed which lets you edit the limit line if needed. This is the quickest and easiest method to create a limit-line test.
- Edit Existing File — Click to open and edit an existing limit-line definition file in the Limit Line Details Editor.
Up to 64 Limit Line Test files can be loaded and running at the same time. If more than one waveform is displayed, loading the file causes the Select Measurements Settings dialog box to open. Limit lines are displayed in the same color as the associated waveform. Multiple limit-line tests can be assigned to the same waveform.
Limit Lines and Data Points
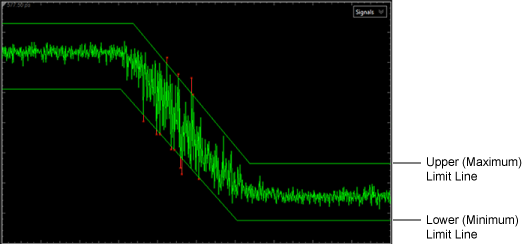
Any data point that occurs above an upper limit line or below a lower limit line causes a failed condition. A failed portion of a waveform that is beyond the limit line boundary is displayed in red as shown in the following picture. The two limit lines in this picture were defined in one Limit Line Test file. One limit line is defined as a maximum limit line and the other limit line is a minimum limit line. Limit lines are defined by points (X,Y) and can be straight mathematical lines or include any combination of horizontal, sloped, and vertical portions. Although individual limit lines can never have a "gap" along the X axis, you can create multiple limit lines in a single file which can have gaps between them. Limit lines are not required to extend across the entire display.
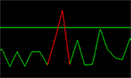
Any portion of a waveform that is shown between adjacent "fail" and "pass" data points is always shown in red, the failure color. On close inspection, you may notice that this line extends into the limit line's "pass" region. This may be more noticeable if the number of acquisition points per waveform has been decreased and the waveform has been zoomed in on as shown in this picture. Here, only 17 data points are shown with one data point in the limit line's "fail" region. This representation of a failed data point is normal and does not indicate a problem. If you turn Command Waveform Points off in the Display Setup (Graticule tab), the line between the point are not displayed and so only the failed data point is shown in red.
Limit Lines Versus Masks
Limit lines are similar to Mask Test, however limit lines are applied to single-valued waveforms while masks are applied to eye diagrams. Limit lines (and masks) always display the pass / fail status which indicates if any data points have occurred outside of the boundaries (lines). You can apply Limit Testing to limit lines (and masks). Limit testing stops data acquisition based on broad range of acquisition, measurement, or data point conditions.
| Available Limit Testing | ||||
|---|---|---|---|---|
| Limit-Line Test Limits |
Mask-Test Limits |
Acquisition Limits |
Measurement Limits |
|
| Limit Lines | ♦ | ♦ | ♦ | |
| Mask Test | ♦ | ♦ | ♦ | |
| Valid Waveforms |
|---|
| Channel waveforms |
| Waveform Memories |
| S-Parameter/Transfer Function Viewer |
Remote Commands
Use the :LLINe subsystem remote programming commands to load limit lines, select the source waveform, and apply horizontal offset. There are no commands for creating limit lines.